
Disclosure: This article is published by Datamagnet. Vendor claims are self-reported unless otherwise noted.
How to Score Passive Candidates Without Overweighting Tenure
Median U.S. job tenure dropped to 3.9 years in January 2024, the lowest mark since 2002, and workers aged 25-34 stay just 2.7 years on average (Bureau of Labor Statistics, 2024). If your scoring model still treats a 14-month stint as a red flag, you're filtering out most of the passive market before you even reach out. This guide shows you how to rebuild a candidate scoring model that weighs tenure fairly instead of first.
TL;DR
- Median U.S. tenure fell to 3.9 years (BLS, 2024), and workers 25-34 average just 2.7 years — a flat "2-year minimum" rule filters out most of the market.
- Tenure is, at best, a weak and inconsistent performance predictor once you control for role complexity and career stage (Ng & Feldman, Journal of Management, 2010).
- Replace a tenure gate with a weighted rubric: cap tenure at 15-20% of the score, and add skill trajectory, promotion velocity, and scope growth instead.
Why Does Tenure Keep Dominating Candidate Scoring Models?
Tenure survived as a scoring shortcut because it's the easiest data point to pull off a resume, not because it's the best predictor of anything. It requires no calculation, no baseline, and no context — just a start date and an end date sitting right there on a LinkedIn profile.
That convenience built a habit most sourcing teams never audited. A 2010 meta-analysis of 350 studies covering nearly 250,000 workers found organizational tenure has, at most, a weak and inconsistent relationship with job performance, with the pattern shifting by role complexity, career stage, and how performance itself gets measured (Ng & Feldman, Journal of Management, 2010).
Here's the part most scoring rubrics miss: tenure isn't one signal, it's a proxy stacking three different assumptions — stability, loyalty, and depth of skill. A candidate can score low on the first two and still be the strongest hire in your pipeline on the third, and a flat tenure cutoff can't tell those apart.
Layoffs made the gap worse. U.S. tech companies cut roughly 191,000 jobs in 2023 and another 95,667 in 2024, with cuts continuing past 127,000 in 2025 (Crunchbase News, updated 2026). A lot of "short tenure" on resumes right now isn't a choice. It's a layoff. For a deeper look at how sourcing teams should read job-change data as a category, our ICP People Search filter reference breaks down which signals correlate with involuntary versus voluntary moves.
How Much Has Average Tenure Actually Changed?
Average tenure has been sliding for over a decade, and it's sliding fastest for exactly the workers most recruiters are trying to reach. As of January 2024, private-sector tenure sat at 3.5 years versus 6.2 years in the public sector, and the youngest cohorts move even faster than that (BLS, 2024).
The generational split is the clearest evidence that "short tenure" is a structural shift, not an individual character flaw. In the first five years of a career, Gen Z workers average just 1.1 years per role, compared with 1.8 years for Millennials, 2.8 for Gen X, and 2.9 for Boomers at the same career stage (Randstad Gen Z Workplace Blueprint, 2025, survey of 11,250 respondents across 15 markets).
Read this chart against your own scoring rubric. If your model penalizes anyone under 3 years at a company, it's penalizing the median 25-34-year-old candidate by design, not by exception.
What Multi-Factor Signals Should Replace a Flat Tenure Cutoff?
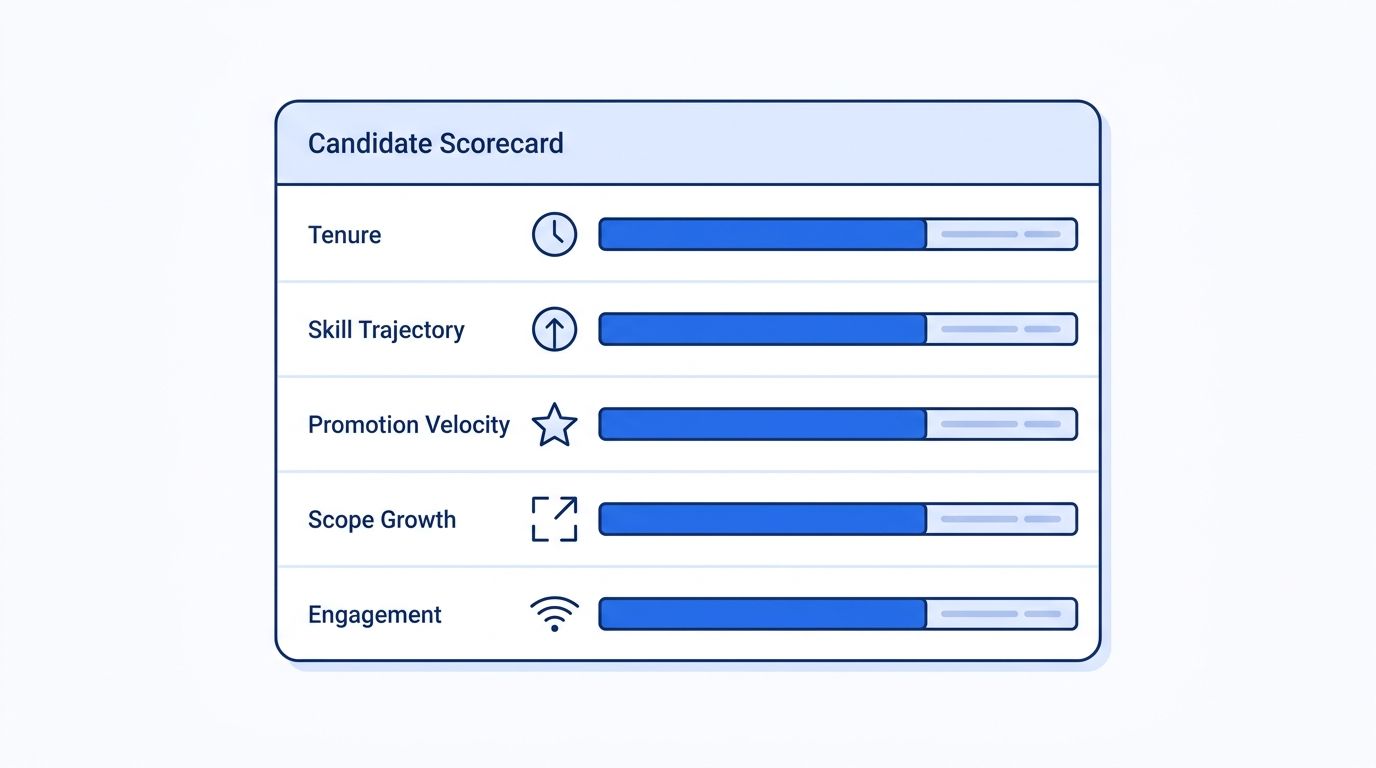
The fix isn't to ignore tenure. It's to stop letting one field carry the whole score. A candidate scorecard that weights tenure alongside skill trajectory, promotion velocity, and scope growth gives you a fuller picture in the same amount of screening time.
Four signals consistently tell you more than a start date and an end date:
- Skill trajectory — new tools, certifications, or technical stack changes added between roles, pulled from structured profile data like the People Profile endpoint.
- Promotion velocity — title changes within the same company, which flag internal validation that a flat tenure number can't show.
- Scope growth — team size, budget, or project complexity increasing role over role, even inside a short stint.
- Engagement signals — recent posts, comments, or activity that show a candidate is still professionally active, available through Person Activity data.
When we mapped tenure against these four signals across a sample of enriched profiles, short-tenure candidates (under 18 months) split into two clean groups: about half showed flat or shrinking scope between roles, and half showed clear scope or title growth despite the short stay. A tenure-only filter can't separate those two groups. A weighted rubric can.
Skill-based evaluation matters here too. LinkedIn's own Economic Graph research found that screening candidates on skills instead of job titles or tenure can expand a qualified talent pool by up to 10 times — and up to 8 times even for AI-related roles (LinkedIn Economic Graph, 2025). A rubric that leans on skill and scope data instead of a resume date stamp isn't just fairer — it's the difference between a shortlist of 40 candidates and a shortlist of 400.
How Do You Build a Tenure-Normalized Scoring Rubric?
You normalize tenure by comparing it to a relevant baseline instead of a fixed number, then cap how much weight it can carry in the total score. That single change stops your rubric from punishing a candidate for matching the market instead of beating some arbitrary rule you set five years ago.
Here's a four-step build:
- Set a baseline per segment. Use BLS or industry benchmark data instead of a gut-feel number — 2.7 years is the median for a 25-34-year-old candidate, not the floor for "stable."
- Score relative to baseline, not absolute years. A candidate at 2.1 years against a 2.7-year baseline is roughly in line with the market, not a flight risk.
- Cap tenure's weight at 15-20% of the total score. Distribute the rest across skill trajectory, promotion velocity, scope growth, and engagement signals.
- Adjust the baseline by company stage. A candidate leaving a startup after 14 months reads differently than one leaving a 50-year-old enterprise after 14 months — pull company headcount and funding stage from a Company Profile lookup to set the right context automatically.
Companies leaning into skills-based scoring back this up at scale: 88% of employers admit they likely filter out qualified candidates over credential or tenure gaps that don't actually predict performance (LinkedIn Economic Graph, 2025). Fixing the weighting fixes that leak without lowering your bar.
How Do You Pressure-Test the Model Before You Roll It Out?
You pressure-test by backtesting the new rubric against candidates you already know the outcome for — hires that worked out and hires that didn't — and checking whether tenure alone would have flagged the wrong group. If the new score and the flat-cutoff score disagree on your best performers, the flat cutoff was wrong.
Pull 30-50 historical candidate records: some short-tenure hires who succeeded, some long-tenure hires who didn't work out. Run both scoring methods side by side. If your old model would have screened out more than a handful of your actual top performers, that's your evidence for the switch — and it's the number to bring to whoever owns the sourcing budget.
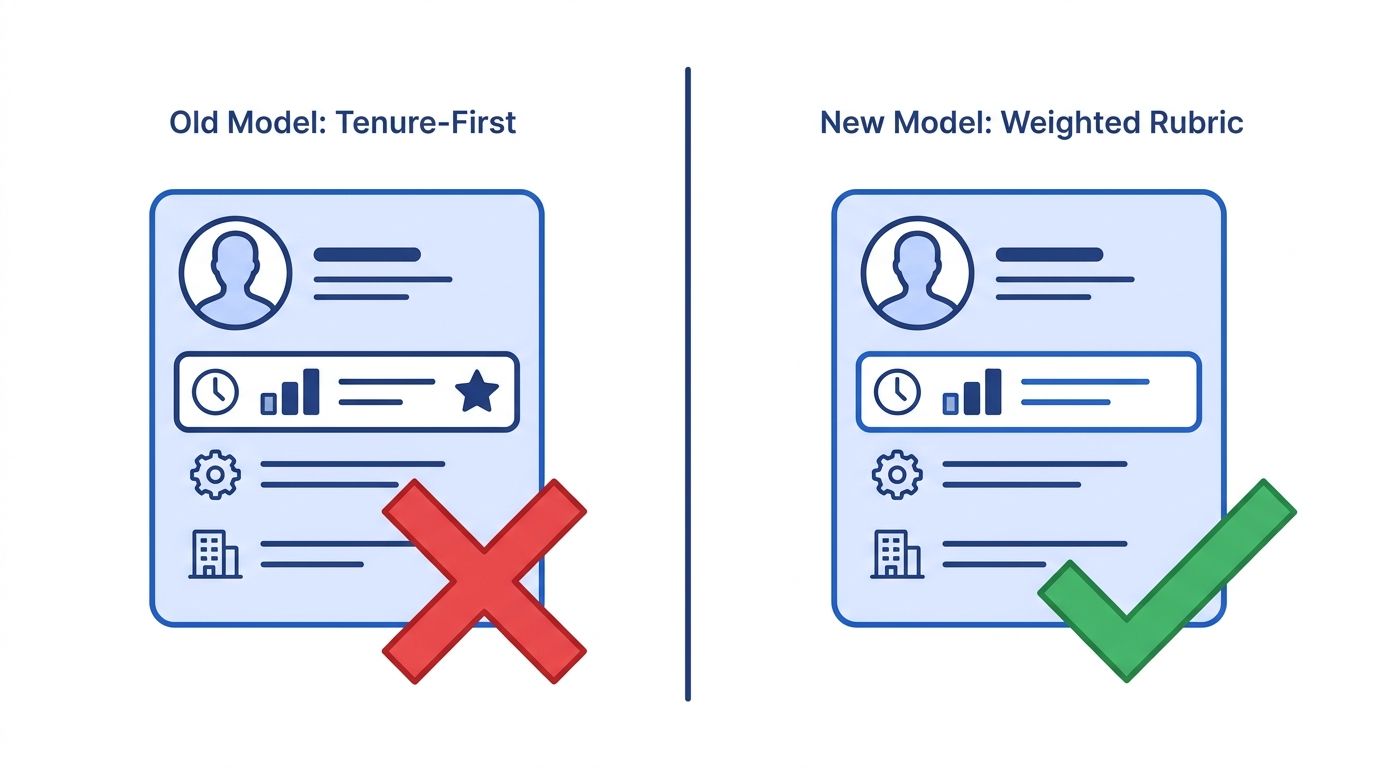
On one backtest run, a candidate with three roles in four years — each one a step up in scope — scored in the bottom third under a flat tenure rule and the top decile under the weighted rubric. That's not a hypothetical edge case. That's the exact profile a 2026 sourcing team is most likely to see next.
Common Mistakes to Avoid When Reweighting Tenure
The most common mistake is swinging too far the other way and dropping tenure to zero weight, which throws away a real (if weak) signal instead of right-sizing it. Ng and Feldman's meta-analysis found tenure does carry a modest, if inconsistent, positive relationship with certain performance measures — it just shouldn't dominate the score (Ng & Feldman, 2010).
1. Using one flat baseline for every role and seniority level. A 2.7-year median applies to early-career workers broadly, not to a director-level candidate. Segment your baseline by seniority, not just age.
2. Ignoring company stage. Startup tenure and enterprise tenure aren't comparable. Normalize against the company someone is leaving, not just the industry.
3. Treating layoffs and voluntary exits the same. A candidate laid off in a documented 2024-2025 cut round shouldn't score the same as one who quit three jobs in a row without cause. Job-change context, not just job-change frequency, is the signal — something a job-change signal monitor can help you track automatically instead of guessing from a resume.
4. Skipping the backtest. Teams that roll out a new rubric without checking it against known outcomes tend to just move the bias somewhere else in the model instead of removing it.
What Does a Well-Calibrated Scorecard Look Like in Practice?
A well-calibrated scorecard produces a shortlist that's wider than your old one without being any less selective — you're trading a bad proxy for better ones, not lowering your standard. If your new rubric surfaces more candidates in the 2-3 year tenure range without a drop in downstream performance or offer-accept rate, the reweighting worked.
Track three numbers after rollout: shortlist size, interview-to-offer ratio, and 12-month retention of the hires the new model surfaced. If retention holds steady while your candidate pool grows, tenure was never the load-bearing signal you thought it was.
Frequently Asked Questions
Does removing tenure from candidate scoring hurt retention?
No, not when you replace it with better signals instead of dropping it entirely. Tenure has, at best, a weak and inconsistent link to performance (Ng & Feldman, 2010). Capping its weight at 15-20% while adding skill trajectory and scope growth typically holds retention steady while widening your candidate pool.
What's a reasonable tenure baseline for passive candidates in 2026?
Use age- and role-adjusted BLS data rather than a flat number: the overall U.S. median is 3.9 years, but workers 25-34 average 2.7 years (BLS, 2024). Set your baseline per seniority segment, not company-wide.
How do I tell a layoff-driven short stint from a job-hopping pattern?
Cross-reference exit timing against known layoff waves — U.S. tech cut over 95,000 roles in 2024 alone (Crunchbase News, 2026) — and look for scope growth across the short stints. A signal-based job-change monitor can flag company-wide exit clusters automatically instead of you checking each resume by hand.
Should tenure weighting differ by industry?
Yes. Tech and startup tenure trends shorter than public-sector or manufacturing roles, where BLS puts public-sector median tenure at 6.2 years versus 3.5 in the private sector (BLS, 2024). Build separate baselines per industry rather than one company-wide rule.
How much of my scoring model should tenure control?
Cap it at 15-20% of the total score, with the rest distributed across skill trajectory, promotion velocity, scope growth, and engagement signals. That keeps tenure as a data point instead of a gatekeeper, which matches what the research actually supports rather than recruiting folklore.
Build the Rubric, Then Automate the Data Behind It
You've got the framework: baseline tenure by segment, cap its weight, add skill trajectory and scope growth, then backtest before you roll it out. The harder part is keeping the underlying data current enough to trust — job history, title changes, and company context all shift constantly for a passive pipeline you're not actively managing.
That's the part worth automating. Pull structured job history straight from LinkedIn profiles with the People Profile API, filter your sourcing pool with ICP People Search instead of manual tenure math, and monitor your best passive candidates for job-change signals so your rubric updates itself instead of going stale. For more on building the sourcing layer underneath a scoring model like this, see our guide to real-time B2B people enrichment.
