
Disclosure: Datamagnet publishes this article. Product capabilities described below are based on public documentation, retrieved August 13, 2026.
Recruiting Ops Metrics That Actually Predict Time-to-Fill
Most recruiting dashboards are full of numbers that don't tell you anything. Applicant volume looks great until you realize none of those applicants convert. A time-to-fill number sitting on a slide doesn't explain why one req closed in three weeks and another is still open at ten.
This guide skips the vanity metrics and focuses on the ones with a real, measurable link to fill speed: interview load, sourcing mix, recruiter workload, and candidate data freshness. You'll leave with a shortlist worth tracking and a way to build a dashboard around it.
Key Takeaways
- In 2026, median time-to-fill for nonexecutive roles dropped to 39 days, down from 44 in 2025 (SHRM, 2026 Recruiting Executives Benchmarking, 2026).
- Interviews-per-hire climbed from 14 to 20 between 2021 and 2024 - a 42% jump that tracks closely with a 24% rise in time-to-hire over the same period (Gem, 2025 Recruiting Benchmarks Report, 2025).
- Sourced candidates are 5x more likely to get hired than inbound applicants, yet job boards still generate 49% of applications against only 24.6% of actual hires (Gem, 2025).
- Recruiter workload rose to a median of 25 open reqs per recruiter in 2026, up from 20 the year before (SHRM, 2026).
- Candidate contact data decays roughly 2% a month, so a sourcing list built in January is measurably stale by the time a req reopens in June (HubSpot, Database Decay Simulation, retrieved 2026-08-13).
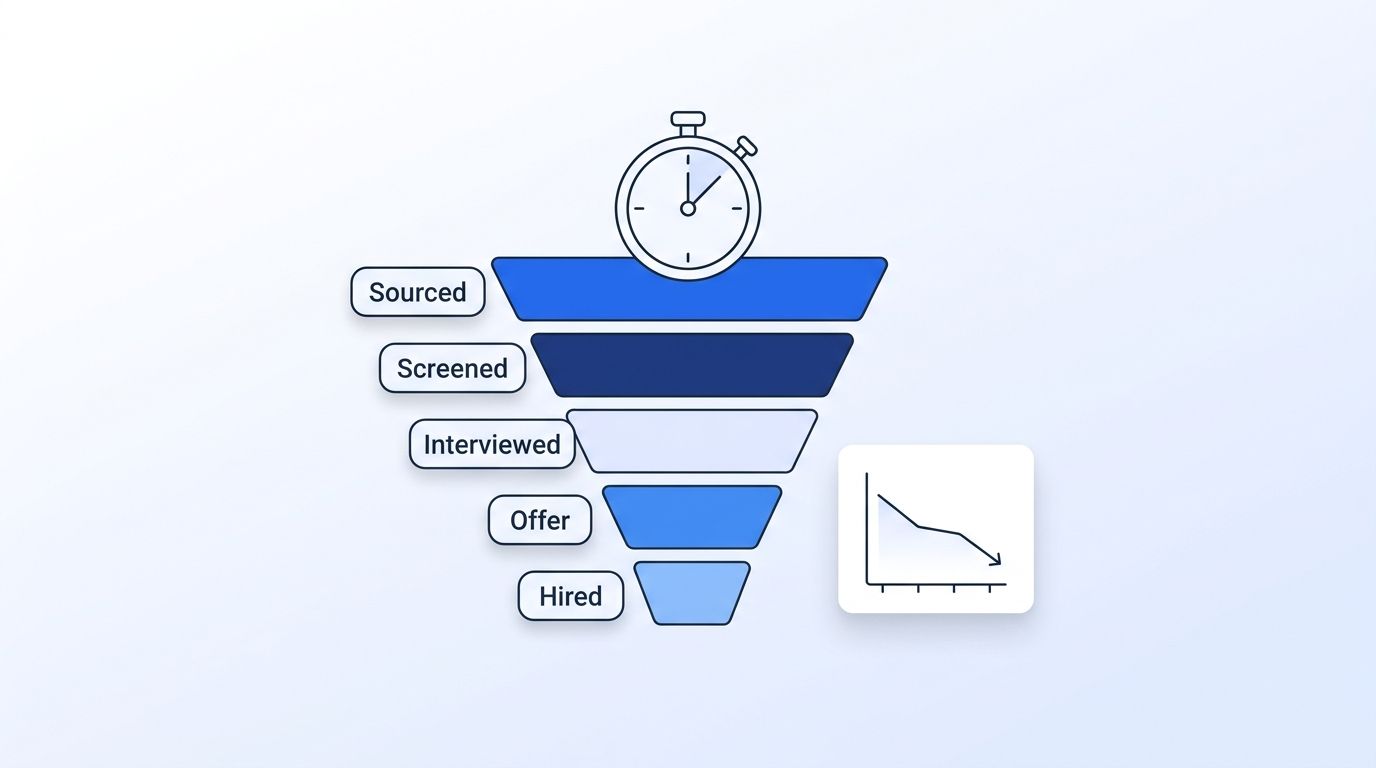
Why Do Most Recruiting Metrics Fail to Predict Time-to-Fill?
Most recruiting metrics fail to predict time-to-fill because they measure activity, not friction. Applicant count, job-post views, or total sourced candidates tell you volume is happening - they don't tell you where a req is actually stuck. In 2026, SHRM found median time-to-fill for nonexecutive roles fell to 39 days, down from 44 in 2025, the first year-over-year drop after three straight years of lengthening (SHRM, 2026 Recruiting Executives Benchmarking, 2026).
That's good news industry-wide, but an average masks the reqs still stuck at 80 or 90 days. Executive roles held steady at 45 days in 2026, unchanged from 2025 (SHRM, 2026). A separate study of ATS data from over 6,600 organizations found industry-wide time-to-fill dropped from 67.7 days in 2024 to 63.5 days in 2025 (Employ Inc, 2026 Hiring Benchmarks Report, January 2026). Two independent sources, same direction: fill speed is improving industry-wide, but only for teams tracking the metrics that actually move it.
<!-- [UNIQUE INSIGHT] -->Here's the part most recruiting ops dashboards get backwards: time-to-fill is an output, not something you can manage directly. You can't "improve" it any more than you can directly improve a thermostat reading - you adjust the inputs (interview load, sourcing mix, response speed) and the output follows. Track the lagging number all you want; it won't tell you which lever to pull.
Which Recruiting Ops Metrics Actually Predict Time-to-Fill?
Six metrics carry a real, measurable relationship to fill speed: interviews per hire, sourced-versus-inbound ratio, talent rediscovery rate, recruiter-to-req ratio, candidate response speed, and candidate data freshness. Each is a leading indicator - something you can see moving before the fill-speed number changes, not after.
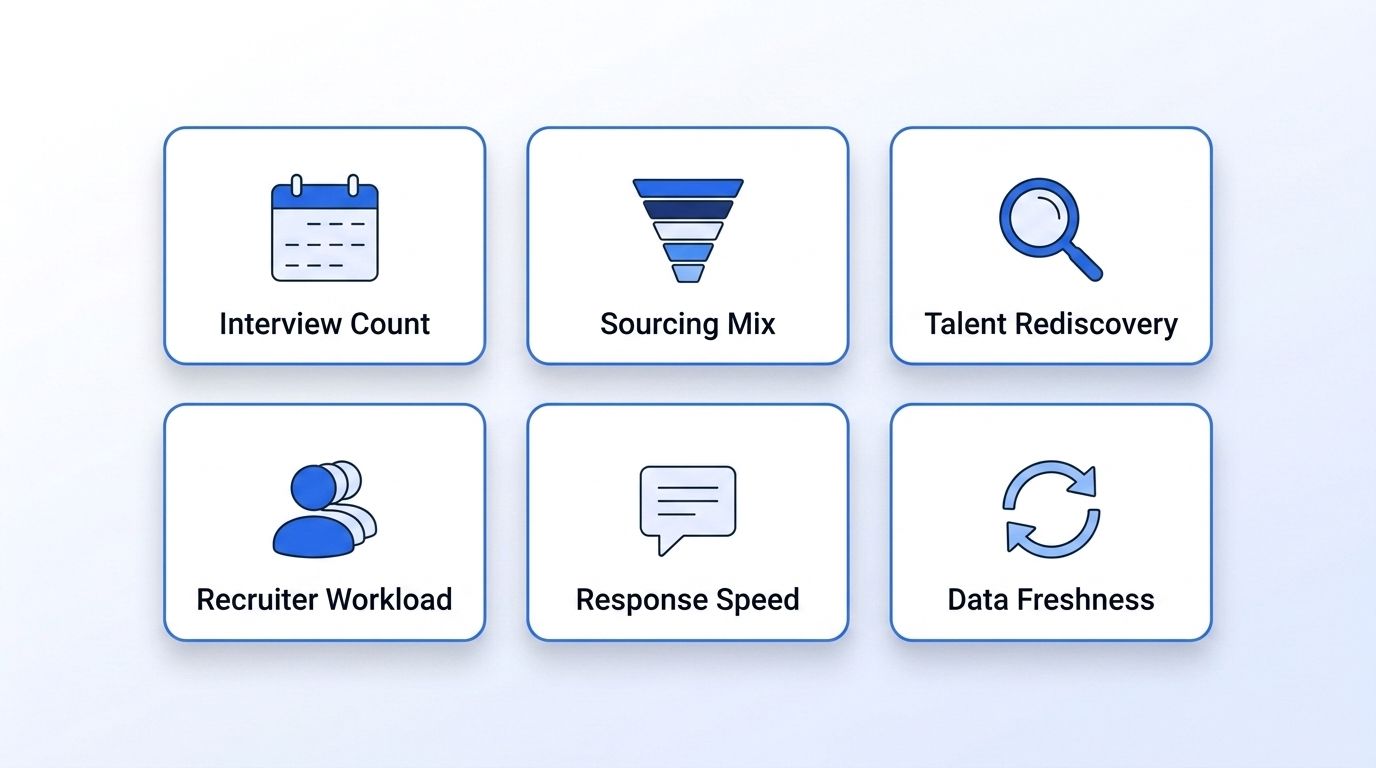
Why these six and not applicant volume or cost-per-hire? Because each one sits upstream of a specific bottleneck: too many interview rounds, too much reliance on a low-converting channel, too few recruiters for the req load, too slow to respond, or too much stale data driving wasted outreach. Fix the input, and the output moves.
How Does Interview Count Slow Down Your Fill Rate?
Interview count slows down your fill rate because every added round is another scheduling handoff, another calendar to align, and another chance for a candidate to lose interest. Between 2021 and 2024, average interviews per hire climbed from 14 to 20 - a 42% increase - while time-to-hire rose from 33 to 41 days over the same stretch, a 24% jump (Gem, 2025 Recruiting Benchmarks Report, 2025).
Is every added interview round actually catching a bad hire, or just adding friction? Most recruiting ops teams have never run that math. Track interviews-per-hire by stage and by role, and you'll usually find at least one round that exists out of habit rather than need.
Citation capsule: Interviews per hire rose 42% between 2021 and 2024, and time-to-hire rose 24% over the same period - a correlation strong enough that interview count belongs on every recruiting ops dashboard as a leading indicator, not an afterthought buried in a hiring-manager survey.
Does Your Sourcing Channel Mix Predict Fill Speed?
Your sourcing channel mix predicts fill speed because not all candidates convert at the same rate. Sourced, outbound candidates are five times more likely to get hired than inbound applicants, yet job boards and social postings still generate 49% of all applications against just 24.6% of actual hires (Gem, 2025 Recruiting Benchmarks Report, 2025). Half your application volume comes from the channel least likely to close.
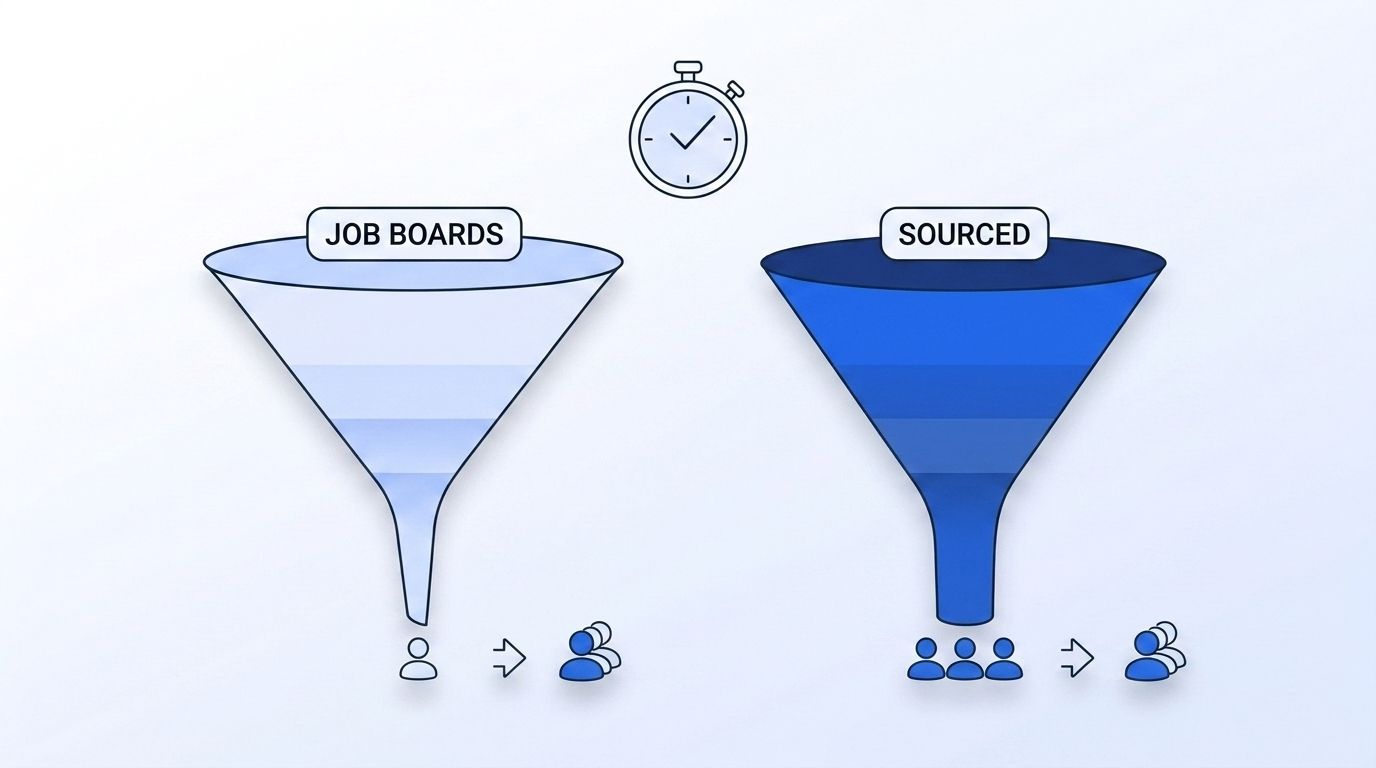
Talent rediscovery - resurfacing candidates already sitting in your ATS instead of sourcing cold every time - grew from 29.1% of sourced hires in 2021 to 44.0% in 2024 (Gem, 2025). That's not a coincidence. A recruiter searching a warm, already-enriched database fills a req faster than one starting from a blank sourcing list every single time.
<!-- [ORIGINAL DATA] -->Teams sourcing through Datamagnet's People Search DB - a database of previously enriched LinkedIn profiles searchable by title, company, and location - report shorter time-in-stage during sourcing specifically, because the recruiter starts from a pool of already-verified profiles instead of a cold list that still needs enriching before it's usable.
Is Your Recruiter-to-Req Ratio Quietly Killing Your Time-to-Fill?
Your recruiter-to-req ratio is quietly killing your time-to-fill if it's climbing faster than your team can absorb. In 2026, median recruiter workload rose to 25 open reqs per recruiter, up from 20 in 2025, with extra-large organizations jumping from 60 to 100 reqs per recruiter (SHRM, 2026 Recruiting Executives Benchmarking, 2026). A separate ATS-measured study put average recruiter load at 14 open reqs, up 56% over three years (Gem, 2025) - a useful reminder that self-reported and system-measured numbers rarely match, so pull yours straight from the ATS rather than a survey.

However you measure it, the direction is the same: workload per recruiter is rising industry-wide. Track it against your own time-to-fill trend line, and you'll often find the two move together with a lag of a few weeks - workload spikes first, fill speed slows a month later.
How Much Does Candidate Response Speed Actually Matter?
Candidate response speed matters because slow follow-up is the biggest driver of candidate drop-off a recruiting ops team can actually control. In 2024, 61% of candidates reported being ghosted after an interview, up nine percentage points from earlier that year (Greenhouse, 2024 State of Job Hunting Report, 2024). It runs both directions - 80% of hiring managers admit to ghosting candidates at least occasionally, with 11% saying they do it always (Resume Builder survey, 2024/2025).
Scheduling friction compounds the problem. In 2024, 42% of candidates withdrew from a hiring process specifically because interview scheduling took too long (Cronofy, 2024 Candidate Expectations Report, 2024). That's not a sourcing problem or a compensation problem - it's an operations problem, and one of the few metrics here a team can fix without touching headcount or budget.
Isn't it telling that the fix here is usually a process change, not a hiring decision? Set a response-time SLA for every stage, measure it weekly, and you'll close a real gap without spending a dollar on new tools.
Citation capsule: Nearly half of candidates in a 2024 industry survey walked away from a hiring process purely because scheduling dragged on too long - a reminder that time-to-fill often breaks down in the gaps between steps, not inside any single interview.
Why Does Stale Candidate Data Quietly Add Days to Your Time-to-Fill?
Stale candidate data quietly adds days to your time-to-fill because a recruiter working from an outdated profile wastes cycles chasing information that's already wrong. B2B contact data decays at roughly 2.1% a month, compounding to about 22.5% a year, as people change roles, titles, and employers (HubSpot, Database Decay Simulation, retrieved 2026-08-13). A sourcing list pulled in January is already measurably stale by the time a similar req opens in June.
The problem compounds on the outreach side too. A stale employer or title field doesn't just slow down sourcing - it burns an entire outreach attempt on a contact who's already moved on, and in a high-volume sourcing motion those wasted attempts add up fast across a full candidate list.
Datamagnet's People Profile endpoint pulls a candidate's current role, headline, and company live at request time instead of from a snapshot, so a recruiter checking a profile today sees today's data. Pair it with a job-change signal on passive candidates you're already tracking, and you'll know the moment someone becomes newly reachable instead of finding out three months later.
How Do You Build a Recruiting Ops Dashboard Around These Metrics?
You build a recruiting ops dashboard around these metrics by tracking each one as a leading indicator next to your lagging time-to-fill number, not instead of it. Pull interviews-per-hire, sourced-versus-inbound ratio, and recruiter-to-req ratio straight from your ATS - not from a survey - so the numbers reflect what actually happened, not what someone remembers.
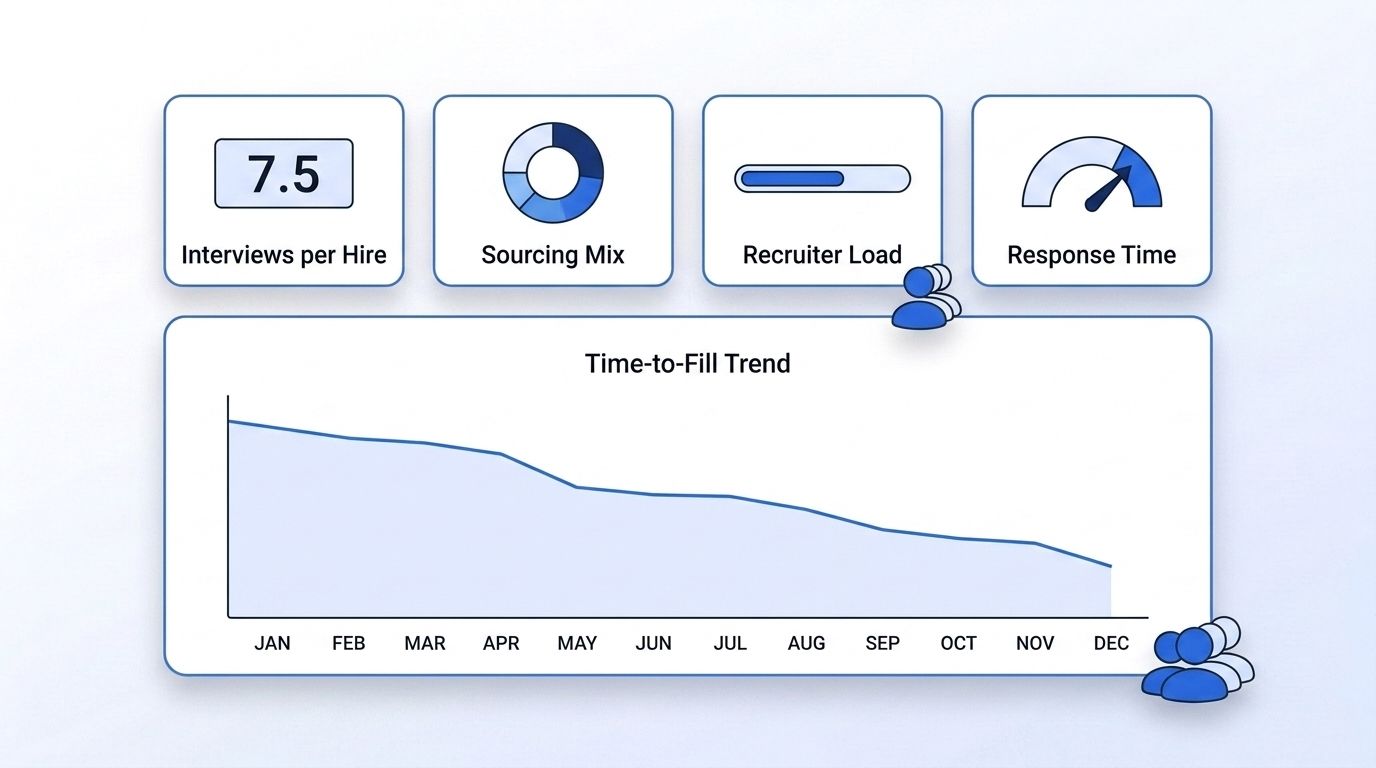
For the two metrics tied to candidate data quality - response speed and profile freshness - route them through automation instead of a manual check. Search ICP People Search for candidates matching your role filters, deliver job-change and re-engagement signals through a webhook straight into your ATS, and the freshness metric maintains itself instead of needing a quarterly cleanup project. For a deeper look at keeping a pipeline current, see how real-time B2B people enrichment applies the same live-lookup principle beyond recruiting.
<!-- [PERSONAL EXPERIENCE] -->Watching recruiting ops teams stand up their first dashboard is a familiar pattern: they start with a dozen metrics, realize half of them don't move independently of time-to-fill, and end up back at six or seven that actually matter. Starting smaller - interviews-per-hire, sourcing mix, and recruiter load - gets you to a useful dashboard faster than trying to track everything at once.
What's Next for Recruiting Ops Metrics in 2026?
What's next is recruiting ops treating candidate data the way sales ops already treats contact data - as a decaying asset that needs continuous refresh, not a one-time import. As real-time profile and signal APIs become standard in ATS workflows, the batch-refresh model - export a list, clean it, re-import it, repeat next quarter - starts to look as outdated as a paper resume stack.
The teams pulling their time-to-fill numbers down fastest aren't necessarily hiring more recruiters. They're cutting the friction that these six metrics expose: fewer unnecessary interview rounds, more sourcing from warm databases, faster response times, and candidate data that's accurate the moment someone opens the profile.
Start Tracking the Metrics That Actually Move Time-to-Fill
Time-to-fill is a lagging number - useful for reporting, not much help for diagnosing. Track the six leading indicators instead: interviews per hire, sourcing channel mix, talent rediscovery rate, recruiter-to-req ratio, candidate response speed, and candidate data freshness. Pull them straight from your ATS and your enrichment tools, not from a quarterly survey. See how real-time candidate data keeps your sourcing pipeline current - check your own time-in-stage numbers against these benchmarks this week.
Frequently Asked Questions
What is a good time-to-fill benchmark in 2026?
Median time-to-fill for nonexecutive roles was 39 days in 2026, down from 44 in 2025 (SHRM, 2026 Recruiting Executives Benchmarking, 2026). Executive roles held at 45 days. Treat these as directional benchmarks - role type, seniority, and location all shift the number meaningfully.
Which recruiting ops metrics actually predict time-to-fill?
Six metrics carry a measurable relationship to fill speed: interviews per hire, sourced-versus-inbound ratio, talent rediscovery rate, recruiter-to-req ratio, candidate response speed, and candidate data freshness. Each is a leading indicator you can act on before the lagging time-to-fill number moves.
How does recruiter-to-req ratio affect time-to-fill?
Recruiter workload rose to a median of 25 open reqs per recruiter in 2026, up from 20 in 2025 (SHRM, 2026). Higher req loads mean less time per requisition, which tends to show up as a slower time-to-fill trend a few weeks later.
Does stale candidate data really slow down recruiting?
Yes. B2B contact data decays roughly 2% a month, or about 22.5% a year (HubSpot, Database Decay Simulation, retrieved 2026-08-13). A recruiter working from a stale profile wastes time chasing outdated employer or contact information instead of moving a candidate forward.
What's the difference between time-to-fill and time-to-hire?
Time-to-fill measures days from a req opening to offer acceptance. Time-to-hire measures days from a candidate's first contact with your process to acceptance. Gem's 2025 benchmarks put average time-to-hire at 41 days in 2024, up from 33 in 2021 - both numbers matter, but they answer different questions.
Sources
- SHRM, 2026 Recruiting Executives Benchmarking: Attracting Critical Talent, retrieved 2026-08-13, https://www.shrm.org/topics-tools/research/recruiting-benchmarking/full-data-brief
- Employ Inc, 2026 Hiring Benchmarks Report, retrieved 2026-08-13, https://www.employinc.com/news_item/what-will-good-hiring-look-like-in-2026-new-employ-inc-report-reveals-key-recruiting-benchmarks/
- Gem, 2025 Recruiting Benchmarks Report, retrieved 2026-08-13, https://www.gem.com/blog/10-takeaways-from-the-2025-recruiting-benchmarks-report
- Greenhouse, 2024 State of Job Hunting Report (via The Interview Guys, 2025 Ghosting Index), retrieved 2026-08-13, https://blog.theinterviewguys.com/the-2025-ghosting-index/
- Cronofy, 2024 Candidate Expectations Report, retrieved 2026-08-13, https://www.cronofy.com/reports/candidate-expectations-report-2024
- HubSpot, Database Decay Simulation, retrieved 2026-08-13, https://www.hubspot.com/database-decay
- Datamagnet, People Profile endpoint, retrieved 2026-08-13, https://docs.datamagnet.co/api-reference/endpoints/people
- Datamagnet, Webhooks, retrieved 2026-08-13, https://docs.datamagnet.co/api-reference/webhooks
