
Disclosure: This article is published by Datamagnet. Product capabilities described below are based on public documentation, retrieved August 6, 2026.
How to Monitor Enrichment Pipeline Health: SLIs and SLOs That Matter
Your enrichment pipeline looks fine in the logs right up until a rep notices half the "verified" job titles are a year stale. In 2023, 68% of data teams took four or more hours just to detect that an incident was happening at all (Monte Carlo Data, The Annual State of Data Quality Survey, 2023) - up from 62% the year before. That's not a monitoring gap. That's flying blind.
This guide walks through the specific SLIs (service level indicators) and SLOs (service level objectives) that actually apply to a data enrichment pipeline, not the generic "is the server up" checks most teams start with. You'll leave with a concrete metric list, target thresholds, and an error budget you can defend to your VP of RevOps.
<!-- [PERSONAL EXPERIENCE] -->We've watched teams wire up uptime monitoring for their enrichment API calls, see a green dashboard for months, and still ship a campaign against 40% stale titles - because "the API responded" and "the API responded with accurate data" are two completely different signals, and most setups only monitor the first one.
Key Takeaways
- 68% of data teams need 4+ hours to detect a pipeline incident, and average resolution time hit 15 hours in 2023 (Monte Carlo Data, 2023).
- An enrichment pipeline needs its own SLI set - match rate, freshness, latency, error rate, completeness, and webhook delivery - not generic server uptime.
- A 99.9% SLO still allows roughly 8 hours 45 minutes of downtime a year; know that number before you promise it to stakeholders.
- B2B contact data decays about 2.1% a month, compounding to 22.5% a year, so "freshness" needs its own SLO separate from uptime (HubSpot, Database Decay Simulation, retrieved 2026-08-06).
- Tie every SLO to an error budget and an alert - a target with no consequence attached is just a wish.
What Makes Enrichment Pipeline Monitoring Different From Regular Uptime Checks?
Enrichment pipeline monitoring is different because "the API responded" tells you nothing about whether the data it returned is still true. A standard uptime check confirms your enrichment provider answered a request within a timeout window. It says nothing about whether the job title, company size, or email it handed back reflects reality today or reality from eight months ago.
Isn't that the whole point of enrichment in the first place - getting data you can trust, not just data you can request? A pipeline can post a perfect 99.99% uptime score while quietly feeding stale, duplicate, or incomplete records into your CRM every single day. Uptime is a necessary SLI. It just isn't a sufficient one.
<!-- [UNIQUE INSIGHT] -->Most teams inherit their monitoring stack from general infrastructure SRE practice, which was built for services where "responded correctly" and "responded with valid data" are the same check. Enrichment pipelines break that assumption - the response can be syntactically perfect and substantively wrong - so the SLI list has to grow beyond what a typical API health check covers.
What Are the SLIs That Actually Matter for an Enrichment Pipeline?
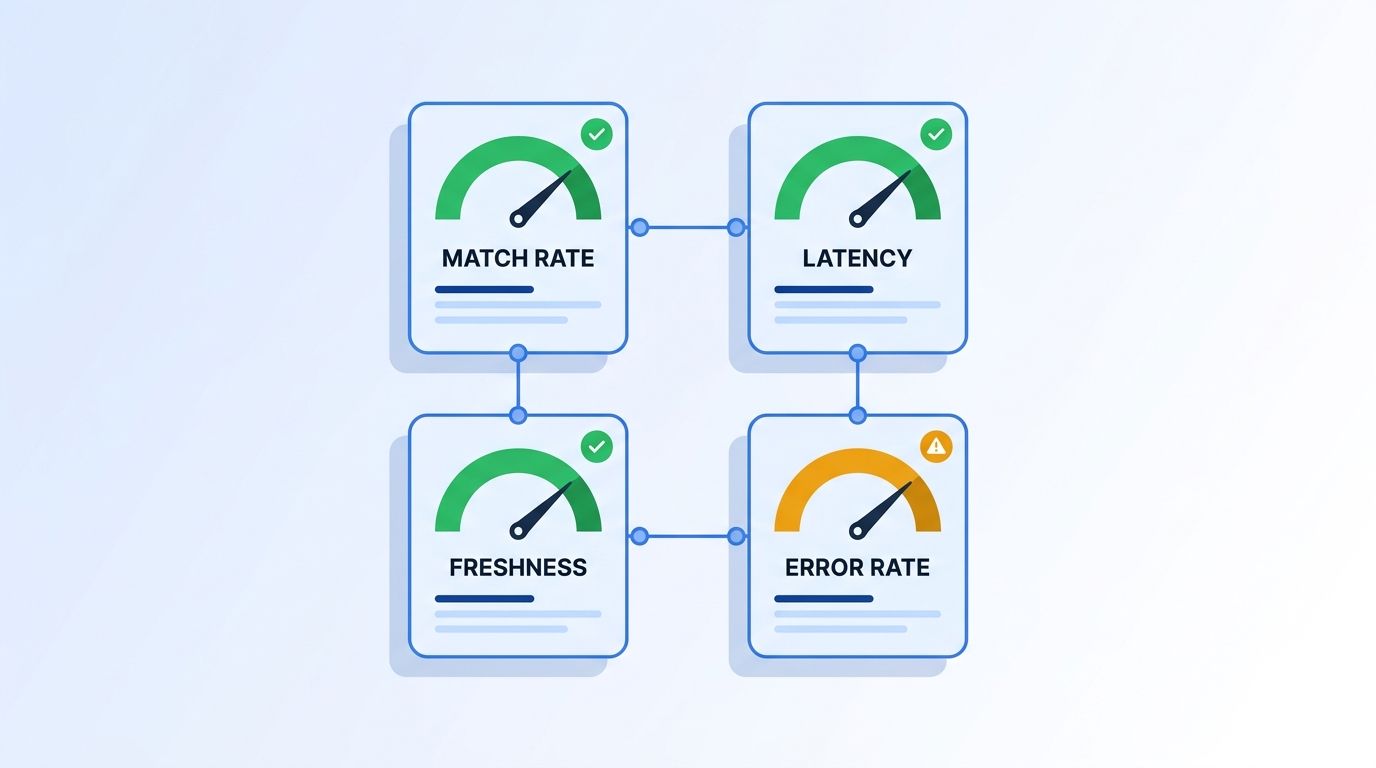
The SLIs that matter most fall into six categories, and skipping any one of them leaves a blind spot a generic uptime dashboard won't catch. Each measures a different way an enrichment pipeline can quietly fail while still returning HTTP 200s.
- Match/enrichment success rate - the percentage of input records (a name, a domain, a LinkedIn URL) that come back with a usable, populated result instead of a null or partial match.
- Data freshness - how recently the underlying source record was verified, not when your database last touched it. A "successful" match on a year-old snapshot is still stale data.
- Latency (p50/p95/p99) - not just average response time. A pipeline with a fast median and a slow p95 will silently time out a meaningful slice of high-value records.
- Error rate by type - 4xx errors (bad input, rate limits) and 5xx errors (provider-side failures) need separate tracking, because they point to different fixes.
- Data completeness - the percentage of expected fields actually populated per record, since a "match" with six of ten fields empty still counts as a match in most logs.
- Webhook/delivery success rate - for pipelines that push enrichment results downstream via webhook, delivery failures are invisible unless you track them separately from the enrichment call itself.
Citation capsule: A 99.9% SLA still permits roughly 8 hours 45 minutes of downtime per year, while 99.99% shrinks that budget to under an hour. Teams that promise "three nines" without checking what that actually allows often over-commit - know your downtime budget in real hours before you write it into an SLA with a customer or internal stakeholder.
Datamagnet's Company Profile endpoint and People Profile endpoint return current headcount, role, and activity data at request time, which is what makes freshness a trackable SLI rather than a guess - you're checking against a live source, not a cached snapshot from last quarter.
How Do You Turn Those SLIs Into SLOs You Can Defend?
You turn an SLI into an SLO by picking a target threshold you can commit to and hold your pipeline accountable against - not the best number you've ever hit, but the number you're comfortable defending in a postmortem. Google's SRE book defines the distinction cleanly: "An SLI is a service level indicator - a carefully defined quantitative measure of some aspect of the level of service that is provided," while "An SLO is a service level objective: a target value or range of values for a service level that is measured by an SLI" (Google SRE Book, Chapter 4, retrieved 2026-08-06).
For an enrichment pipeline, realistic starting SLOs look like this:
| SLI | Example SLO | Why this threshold |
|---|---|---|
| Match/enrichment success rate | ≥ 95% on ICP-qualified records | Below this, reps start distrusting the data source entirely |
| p95 latency | < 2 seconds per record | Keeps synchronous enrichment calls from timing out downstream workflows |
| Freshness | ≤ 30 days since last verification | Matches the pace of role and company changes, not an arbitrary calendar |
| Error rate (5xx) | < 1% of requests | Anything higher signals a provider-side reliability problem, not noise |
| Data completeness | ≥ 90% of expected fields populated | A record missing a third of its fields isn't really "enriched" |
| Webhook delivery | ≥ 99% successful within 3 retries | Below 95% is treated as a warning threshold industry-wide |
Don't copy these numbers blindly - your ICP, your record volume, and your downstream tooling all shift the right target. Start with your last 90 days of actual performance data, then set the SLO slightly above your current baseline instead of an aspirational number pulled from a blog post.
How Do You Calculate an Error Budget for an Enrichment Pipeline?
You calculate an error budget by subtracting your SLO from 100% and applying that percentage to your actual request volume over the measurement window. An error budget is simply 1 minus the SLO (Google Cloud, SRE Workbook - Error Budget Policy, retrieved 2026-08-06): a 99.9% SLO leaves a 0.1% error budget, which at 1,000,000 enrichment calls over four weeks works out to 1,000 allowable failed or degraded requests before the team pauses feature work to prioritize reliability.
That number matters because it turns "reliability" from a vague feeling into a spendable resource. Once your team burns through the budget, the rule is simple: stop shipping new enrichment integrations and fix the pipeline first. Teams that skip this step tend to keep shipping features on top of a degrading pipeline until the failure becomes too visible to ignore - usually right as a big campaign goes out.
<!-- [ORIGINAL DATA] -->Pipelines that track error budget burn rate in real time - not just a monthly rollup - catch runaway degradation days earlier than teams checking a dashboard once a week. A burn-rate alert firing at "you've used 50% of this month's budget in the first four days" gives you time to react before the budget hits zero; a monthly report just tells you it's already gone.
How Do You Instrument and Dashboard These Metrics?
You instrument these metrics by logging structured events at every enrichment call - not just success/failure, but match status, response time, field completeness, and data timestamp - then aggregating them into a dashboard your whole data team actually looks at. Wrap every call to your enrichment provider (Datamagnet or otherwise) with a logging layer that captures the SLI fields before the response gets passed downstream, so you're not reconstructing history from application logs after the fact.
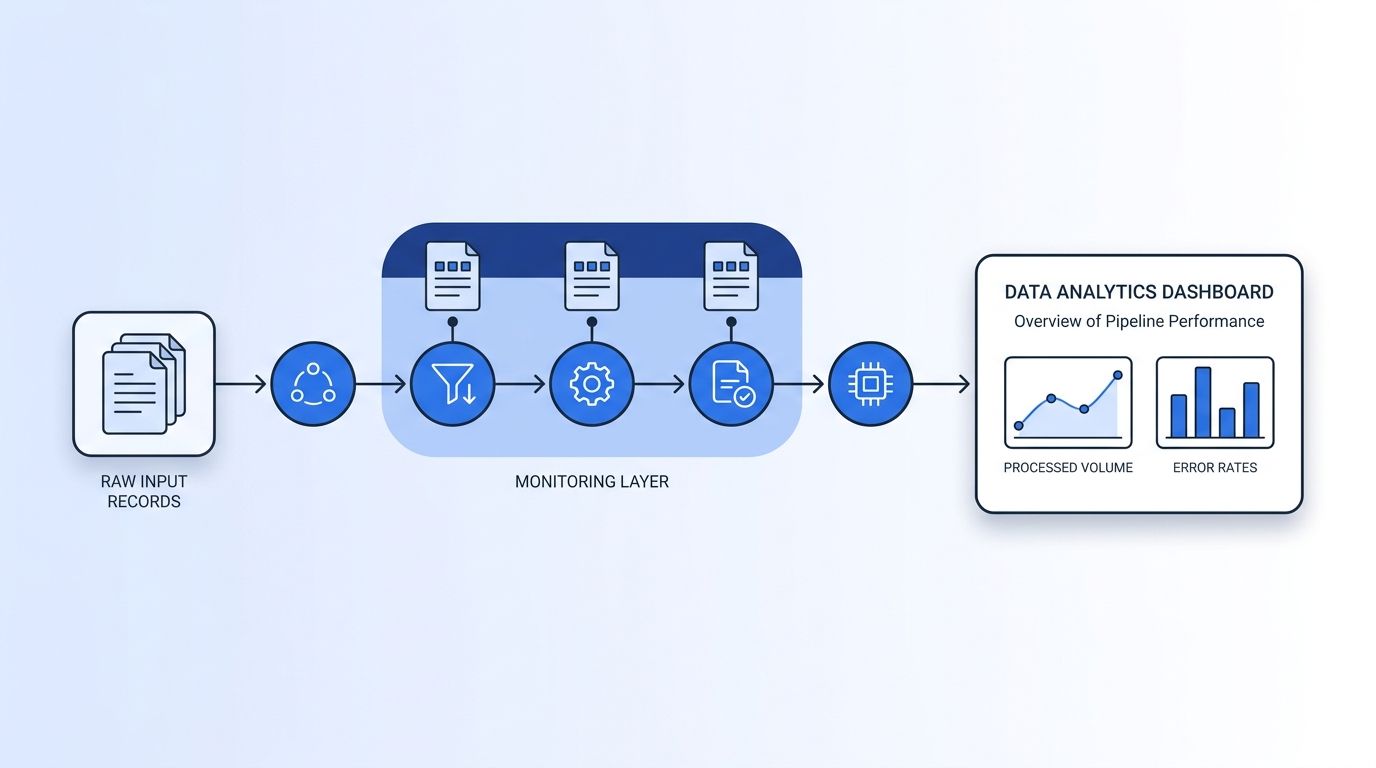
Track error type separately from error rate. A spike in 429 responses means you're hitting rate limits and need to throttle or batch requests - review the Errors reference to distinguish rate-limit errors from authentication or validation failures, since each demands a different fix. A spike in 5xx responses means the problem sits upstream with the provider, not your integration code.
Citation capsule: B2B contact data decays roughly 2.1% a month, compounding to about 22.5% within a year (HubSpot, Database Decay Simulation, retrieved 2026-08-06). A freshness SLI that only checks "did the API respond" misses this entirely - you need a timestamp-based staleness metric running alongside your uptime checks, not instead of them.
How Should Alerting Tie Back to Your Error Budget?
Alerting should tie back to your error budget by triggering on burn rate, not just raw threshold breaches - a single failed request shouldn't page anyone, but burning 20% of a month's budget in one afternoon should. Set two alert tiers: a fast-burn alert for sudden spikes (something broke right now) and a slow-burn alert for gradual degradation (something is quietly getting worse over days).
For freshness specifically, pair your dashboard with an event-driven signal instead of relying on scheduled re-checks alone. Datamagnet's job-change signal can flag a tracked contact the moment their employer field changes, and routing that through a webhook turns freshness monitoring into something your pipeline reacts to automatically, rather than a report someone has to remember to pull.
Why does the split between fast-burn and slow-burn alerts matter so much? Because a single alert threshold either fires constantly on noise or misses slow degradation entirely - you need both speeds covered, or you'll end up ignoring the alert channel altogether within a month.
What Mistakes Wreck Enrichment Pipeline Monitoring?
The most common mistake is monitoring uptime alone and calling it done - a pipeline can hit 99.99% API availability while still delivering garbage data, because availability and accuracy are measured by completely different signals. Root-cause analysis across more than 11 million monitored tables found pipeline execution faults account for 26.2% of data quality incidents, more than any other single cause (Monte Carlo Data, Data Quality Statistics & Insights, 2026).
1. Treating "responded" as "correct." Teams check that the API call succeeded and stop there. The fix: log match status and field completeness on every call, not just HTTP status codes.
2. Setting SLOs before measuring a baseline. Picking a 99.5% match rate target with no idea what you're currently hitting sets you up to either miss constantly or sandbag the target. The fix: pull 90 days of real data first.
3. Checking freshness on a schedule instead of continuously. A quarterly refresh leaves months of accumulated decay unaddressed between runs. The fix: pair scheduled checks with event-driven signals for anything time-sensitive.
4. No error budget policy. Setting a target with no consequence attached to missing it means the target gets ignored the first time a deadline is tight. The fix: define what happens - feature freeze, escalation, root-cause review - before you need it.
5. Averaging away the tail. A pipeline that reports average latency instead of p95/p99 hides exactly the slow requests most likely to time out and drop a high-value record. The fix: always track percentiles, never just the mean.
What Does a Healthy Enrichment Pipeline Look Like in Practice?
A healthy enrichment pipeline shows green across all six SLIs at once - not just uptime - with match rate holding above your SLO, p95 latency under two seconds, and freshness data showing no record older than your staleness threshold. If you're seeing degradation in one metric while others stay healthy, that's useful diagnostic information: a latency spike with a stable match rate usually points to a provider capacity issue, not a data quality problem.
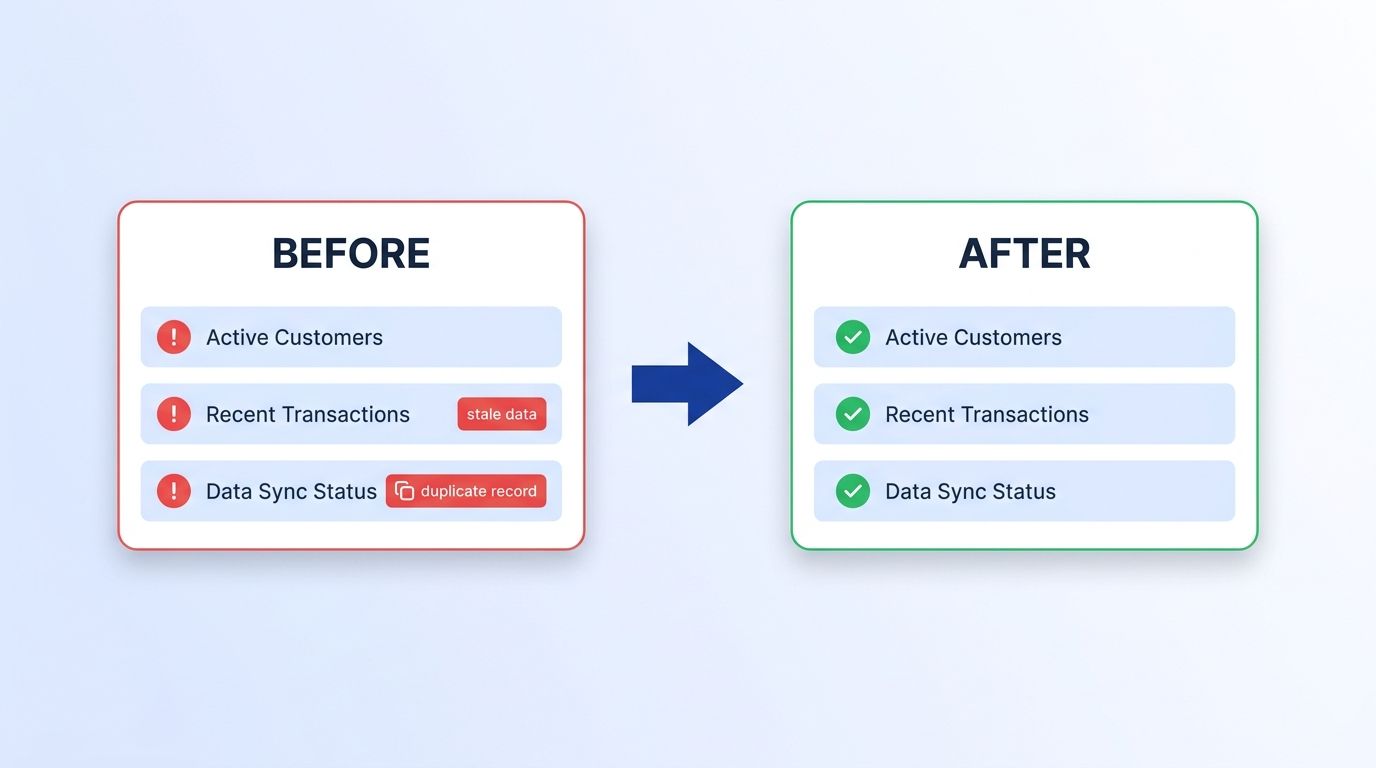
Once your baseline stabilizes, the next-level move is tracking mean time to detect (MTTD) and mean time to resolve (MTTR) for pipeline incidents specifically, then working to shrink both. Teams still relying on manual checks report average resolution times climbing past 15 hours per incident (Monte Carlo Data, 2023); automated alerting tied to error budgets is how you pull that number down toward minutes instead of hours.
For a deeper look at applying real-time verification to the freshness problem specifically, see how real-time B2B people enrichment closes the gap a scheduled batch process always leaves open, and how a programmatic CRM enrichment workflow keeps these SLIs healthy without manual review.
Frequently Asked Questions
What's the difference between an SLI, an SLO, and an SLA?
An SLI is the metric itself - match rate, latency, freshness. An SLO is your internal target for that metric, like "95% match rate." An SLA is a contractual agreement with consequences attached, usually with a customer, built on top of one or more SLOs (Google SRE Book, retrieved 2026-08-06).
How many SLIs should an enrichment pipeline track?
Start with the six core ones: match rate, freshness, latency, error rate, completeness, and webhook delivery. Tracking more than eight or nine tends to dilute focus - teams stop checking the dashboard regularly once it gets too crowded to scan in under a minute.
What SLO should I set if I have no historical data yet?
Run for 30-90 days with monitoring in place but no target enforced, then set your SLO slightly above whatever baseline you observe. Starting with an arbitrary number pulled from industry benchmarks usually sets teams up to either miss constantly or under-shoot what the pipeline can actually deliver.
Can freshness really be monitored in real time?
Yes, if your enrichment source supports live lookups instead of returning cached snapshots. Datamagnet's People Profile endpoint and Company Profile endpoint fetch current data at request time, and Credit Balance monitoring lets you track cost burn rate alongside data freshness in the same dashboard.
How much downtime does a 99.9% SLO actually allow?
About 8 hours 45 minutes per year, or roughly 43 minutes per month. That's the number to check before you commit to "three nines" in an internal SLO or a customer-facing SLA - it's a bigger allowance than most teams expect until they do the math.
Start Treating Pipeline Health as a Property of the System, Not a One-Time Check
An enrichment pipeline that only monitors uptime is measuring the wrong thing - match rate, freshness, latency percentiles, error rate, completeness, and webhook delivery each catch a failure mode uptime alone will miss. Set SLOs against a real 90-day baseline, calculate the error budget in concrete numbers, and tie alerting to burn rate instead of raw thresholds so you catch degradation days before it reaches a rep's outreach list. Review Datamagnet's security and data practices for an example of how uptime targets get published alongside real infrastructure commitments. See how real-time people and company data keeps enrichment pipelines measurably healthy - run it against your current SLI baseline this week.
Sources
- Monte Carlo Data, The Annual State of Data Quality Survey, retrieved 2026-08-06, https://montecarlo.ai/blog-data-quality-survey
- Monte Carlo Data, Data Quality Statistics & Insights From Monitoring +11 Million Tables, retrieved 2026-08-06, https://montecarlo.ai/blog-data-quality-statistics
- HubSpot, Database Decay Simulation, retrieved 2026-08-06, https://www.hubspot.com/database-decay
- Google SRE Book, Chapter 4: Service Level Objectives, retrieved 2026-08-06, https://sre.google/sre-book/service-level-objectives/
- Google Cloud, SRE Workbook - Error Budget Policy, retrieved 2026-08-06, https://sre.google/workbook/error-budget-policy/
- Gartner, Data Quality topic hub, retrieved 2026-08-06, https://www.gartner.com/en/data-analytics/topics/data-quality
- Datamagnet, People Profile endpoint, retrieved 2026-08-06, https://docs.datamagnet.co/api-reference/endpoints/people
- Datamagnet, Company Profile endpoint, retrieved 2026-08-06, https://docs.datamagnet.co/api-reference/endpoints/company
- Datamagnet, Webhooks, retrieved 2026-08-06, https://docs.datamagnet.co/api-reference/webhooks
