
Disclosure: Datamagnet publishes this article. Product capabilities described below are based on public documentation, retrieved 2026-09-16.
How to Build an Internal Status Page for Your GTM Data Pipeline
Bad data doesn't send an error message. It just sits in your CRM looking fine until a rep pulls a contact whose company changed six months ago, or your enrichment API quietly starts failing and nobody notices for a week. In 2025, Validity found that 37% of organizations report a direct revenue loss tied to poor CRM data quality, and workers lose an average of 13 hours a week just searching for basic account information (Validity, "The State of CRM Data Management in 2025," 2025).
An internal status page turns that invisible failure into a visible one. Instead of finding out your job-change signal feed died from an angry SDR in Slack, you see it on a dashboard the moment it happens. This guide walks through building one for your own GTM data pipeline — the same concept a hosting provider uses for uptime, pointed at your enrichment calls, CRM syncs, and webhook deliveries instead.
<!-- [PERSONAL EXPERIENCE] -->We've watched this exact failure play out from the vendor side: a customer's CRM sync silently stopped updating company headcount fields for two weeks before anyone flagged it, because nothing in their stack was watching the pipeline itself, only the CRM's front end.
TL;DR
- 37% of organizations report direct revenue loss from poor CRM data quality, and 1 in 4 report a 20%+ annual revenue decline tied to it (Validity, 2025).
- 73% of organizations have experienced outages linked to ignored or suppressed alerts, and 87% of outages are judged preventable after the fact (Splunk, 2025; Uptime Institute, 2025).
- Build your status page around four stages: source data, enrichment/API calls, CRM sync and webhooks, and downstream signal delivery.
- Monitor freshness, not just uptime — a pipeline can be "up" and still be feeding stale data.
- Route alerts by severity and pipeline stage instead of pinging one channel for everything, or your team will start ignoring the page entirely.
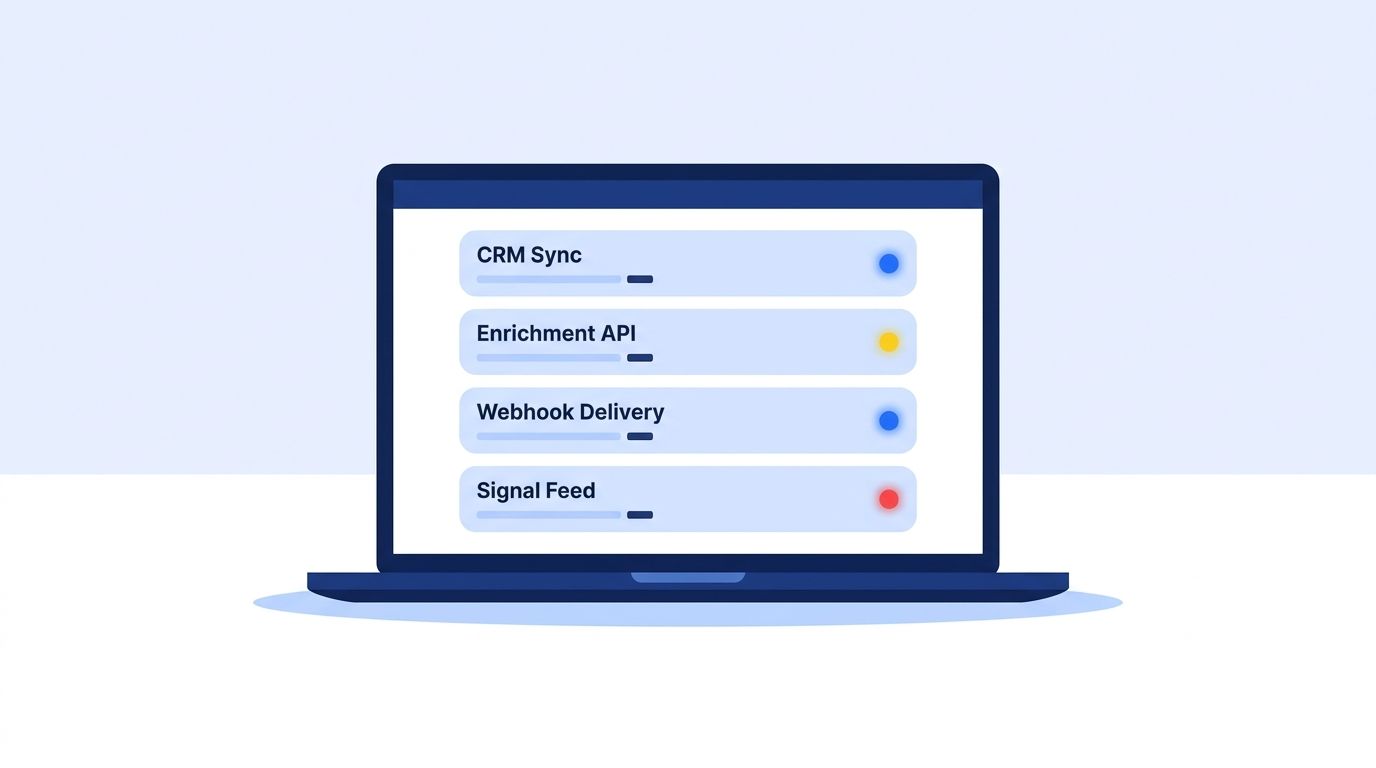
What Do You Need Before You Start?
Prerequisites checklist:
- Read access to every pipeline component: enrichment API keys, CRM webhook configs, and any ETL or reverse-ETL jobs
- A lightweight place to store status history — a Postgres table, Airtable base, or a tool like Cachet or Upptime
- A Slack channel or email alias dedicated to pipeline alerts, separate from customer-facing channels
- Basic familiarity with cron jobs, webhooks, and reading HTTP status codes
- Time: 1 day for a working v1, 3-5 days for a hardened version with history and alerting
- Difficulty: Intermediate
Step 1: How Do You Map Every Stage of Your GTM Pipeline?
By the end of this step, you'll have a written list of every hop your data takes, from source to CRM. Most teams can't build a status page because they've never actually diagrammed the pipeline — they know the CRM and the vendor, but not the four or five steps data passes through between them.
A typical GTM pipeline has four stages worth watching independently: source data (a LinkedIn profile, a form fill, an intent signal), enrichment/API calls (the service that adds firmographic or contact detail), CRM sync and webhooks (how enriched data lands in Salesforce or HubSpot), and downstream signal delivery (alerts, routing rules, reporting). Each stage fails differently, so each needs its own check.
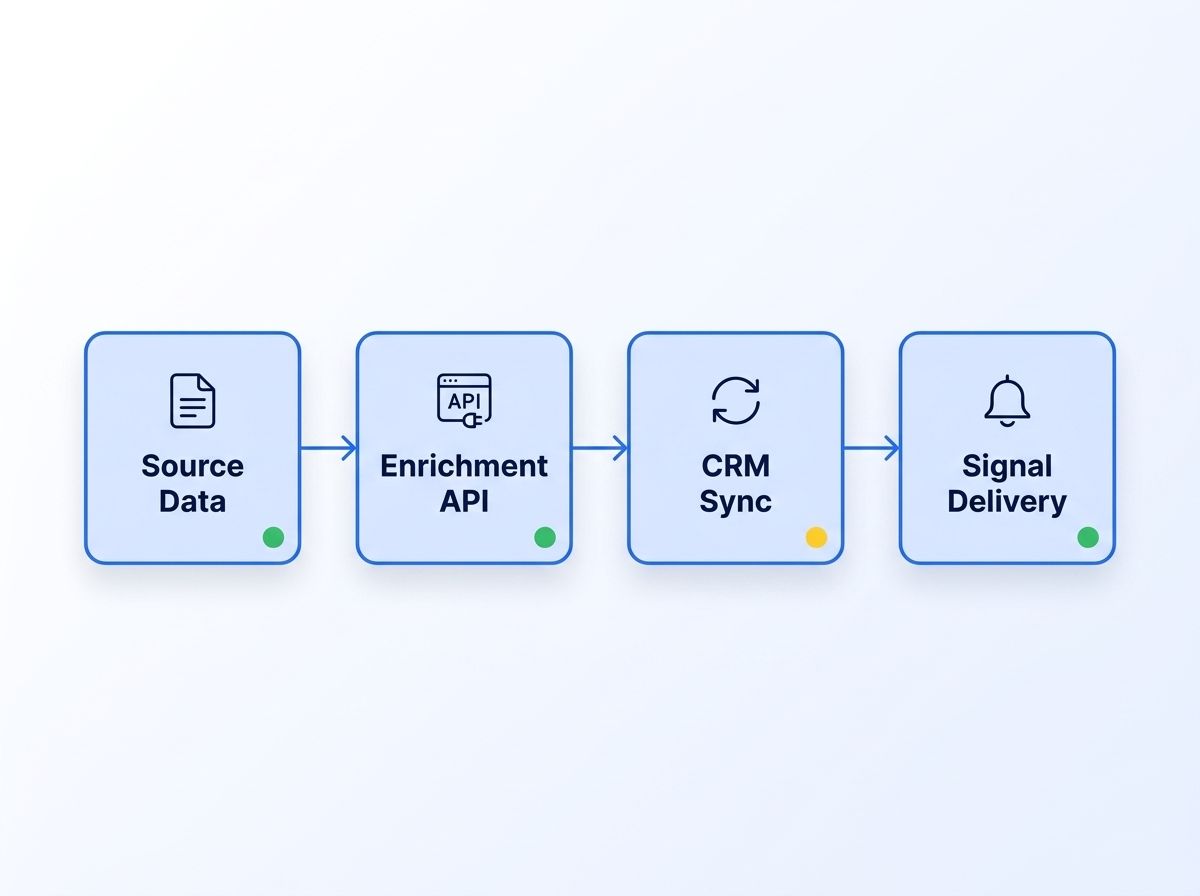
Most "data quality incidents" aren't data problems at all — they're pipeline problems wearing a data costume. A stale company headcount field usually isn't bad data; it's a sync job that stopped running three weeks ago. Mapping the pipeline first, before building any dashboard, is what lets you tell the two apart.
Step 2: How Do You Define a Health Check for Each Stage?
By the end of this step, every pipeline stage has a concrete pass/fail test instead of a vague sense that "it's probably fine." A health check needs three things: a status signal (success, error, or timeout), a latency measurement, and a freshness timestamp for the last successful run.
For an enrichment API, that means logging the HTTP response code on every call and watching for a rising error rate, distinguishing rate-limit and authentication failures from transient timeouts. Pair that with a check against your credit balance, since a pipeline that "fails" is sometimes just out of quota.
Webhook delivery needs its own check, separate from the API's own uptime. In 2025, only 50% of API teams reported using webhooks at all, well behind REST's 93% adoption (Postman, "2025 State of the API Report"), which means webhook failure modes are less battle-tested across the industry than plain request/response APIs. Log every webhook delivery attempt and its response code, not just the ones that fail.
| API Pattern | Adoption Among API Teams |
|---|---|
| REST | 93% |
| Webhooks | 50% |
| WebSockets | 35% |
| GraphQL | 33% |
Source: Postman, 2025 State of the API Report.
Citation capsule: Half of API teams rely on webhooks for event delivery, but webhooks are inherently best-effort — a dropped delivery doesn't always retry automatically. Treating webhook delivery as a health check on its own, separate from the sending API's uptime, catches the specific failure mode of "the API is fine, the message never arrived."
Step 3: How Do You Centralize Status Signals in One Place?
By the end of this step, every health check result lands in a single table instead of five different logs nobody checks together. Poll each stage every one to five minutes, and store the timestamp, status, and latency for each run — this history is what turns "is it down right now" into "how often does this actually break."
If you're already tracking signal monitors through Datamagnet's Create Signal endpoint, treat those monitors as pipeline stages too. A job-change signal that stops firing is just as much a pipeline failure as a broken CRM sync, even though it never throws an obvious error.
A simple Postgres table with columns for stage, status, checked_at, and latency_ms is enough for a v1. You don't need a dedicated time-series database until you're storing months of check history at sub-minute granularity.
Step 4: How Do You Build the Status Page Itself?
By the end of this step, you have a page that shows current status and recent history for every stage, viewable by anyone on the GTM team without pulling logs. You have three realistic options: an open-source status tool like Cachet or Upptime, an internal dashboard built in a tool like Retool, or a small custom page.
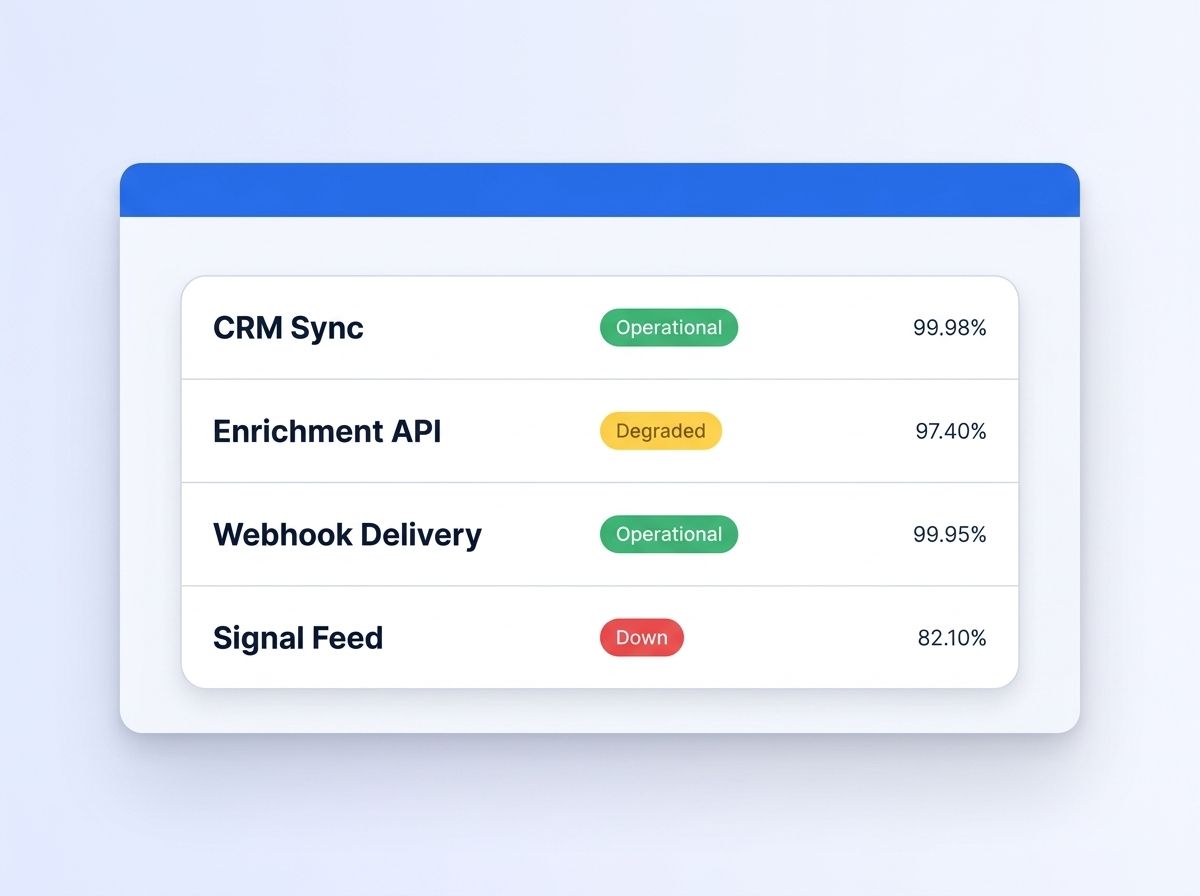
Whichever you choose, show three things per stage: current status, a rolling uptime or freshness percentage, and a short incident log with timestamps. If you're wiring up your first health check against a live API, Datamagnet's quickstart guide is a reasonable model for how to structure that first request-and-log loop before you generalize it across every stage.
Verification: Kill one pipeline stage on purpose — pause a sync job or revoke a test API key — and confirm the page flips to "degraded" or "down" within your polling interval. If it doesn't, the check isn't actually wired to the real signal.
Step 5: Wire Up Alerts Without Creating Alert Fatigue
By the end of this step, the right person gets pinged for the right failure, and nobody starts muting the channel. In 2025, 73% of organizations experienced an outage linked to ignored or suppressed alerts, and separately, engineering time spent on operational toil rose to 30% in 2025, up from 25% the year before (Splunk, 2025; Catchpoint, "The SRE Report 2025").
Alert only on state changes or on failures sustained past a threshold — three consecutive misses, not one blip. Route by severity: a customer-facing sync failure pages someone immediately, while a delayed non-critical report waits for business hours. If you need to silence a monitor during planned maintenance, use an explicit pause like Datamagnet's Update Signal endpoint instead of muting the whole alert channel.
Step 6: How Do You Set Freshness and Uptime SLAs?
By the end of this step, "healthy" has a number attached to it instead of a feeling. Pick a target per stage — for example, 99.9% API uptime and a 15-minute maximum CRM sync lag — and track actual performance against it weekly. Datamagnet publishes its own 99.9% uptime target publicly; internal SLAs for your pipeline don't need to be public, but they do need to be written down somewhere your team actually looks.
Review your SLA targets whenever an underlying vendor ships reliability changes — Datamagnet's changelog is a useful model for how granular that kind of update tracking should be. For more on how enrichment reliability affects downstream CRM accuracy, see how programmatic CRM enrichment reduces manual cleanup.
What Mistakes Should You Avoid?
The single most common mistake is monitoring uptime while ignoring freshness — a pipeline can return a 200 status code on every call while still feeding hour-old data into your CRM. Uptime and freshness are different questions, and a status page that only answers one is only half built.
1. Confusing "responding" with "correct." A health check that only pings an endpoint misses the case where the endpoint works but returns stale or wrong data. Add a freshness timestamp check alongside every uptime check.
2. Letting customers find out first. Across a 2026 survey of Global 2000 companies, 47% said customers were often the first to detect a service problem, and 81% of those said it eventually cost them customers (Splunk with Oxford Economics, "The Hidden Costs of Downtime 2026"). The same pattern hits internal pipelines — a rep flagging bad data in Slack is your status page failing at its one job.
<!-- [ORIGINAL DATA] -->3. Skipping the "who gets paged" decision until after launch. Teams that define alert routing before building the dashboard ship a page people actually trust within the first week. Teams that bolt on routing afterward tend to spend the first month arguing about which Slack channel owns which stage — a fixable problem, but one that's cheaper to solve up front.
4. Exposing internal detail on a page meant for external stakeholders. If leadership or other departments need visibility, build a separate, aggregated view — operational or degraded, nothing more granular — rather than handing out the raw engineering dashboard.
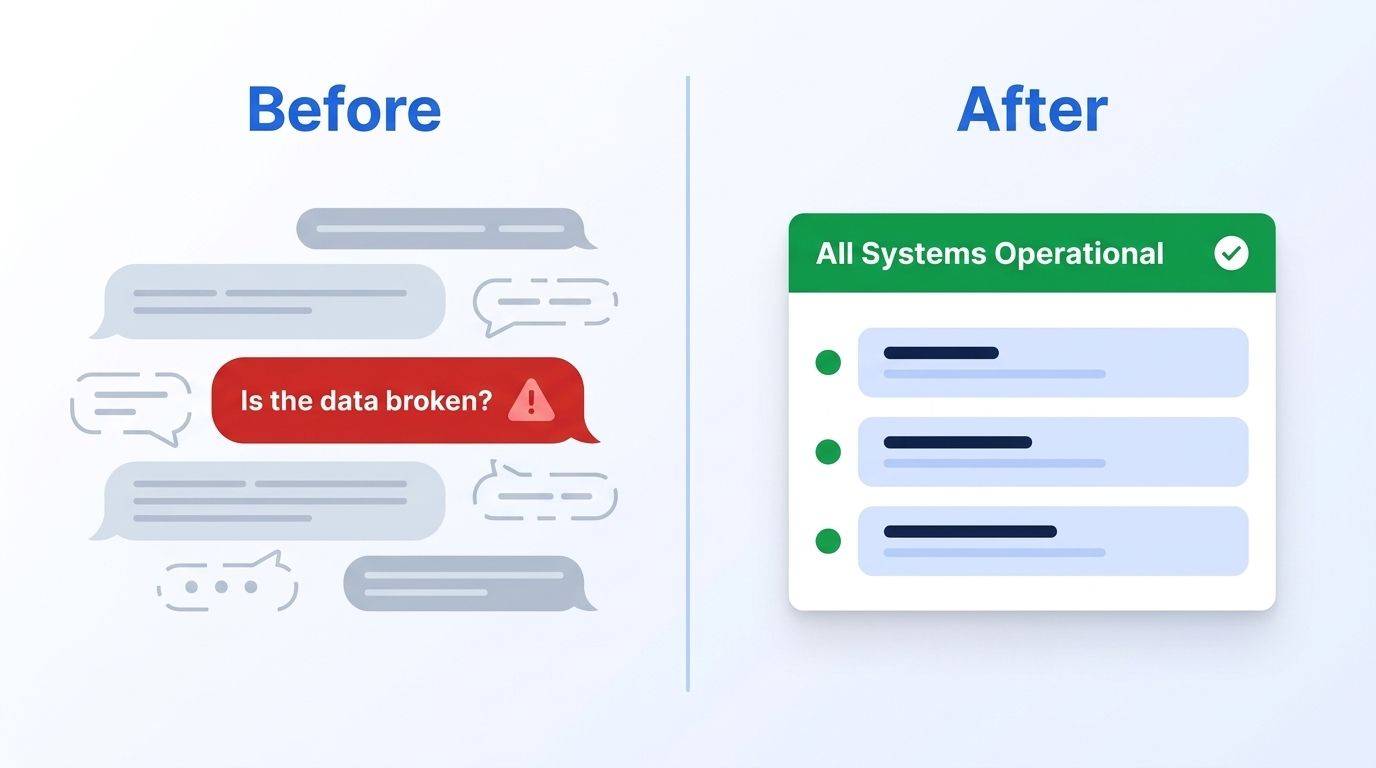
What Does Success Look Like Once It's Live?
If everything went correctly, your team should stop asking "is the data broken?" in Slack and start checking the page instead. That single behavior shift — from asking a person to checking a dashboard — is the clearest sign the page earned its place in the workflow.
Track two numbers going forward: how often a stage flips to degraded or down, and how long it takes someone to notice versus how long your monitor took to detect it. As a stretch goal, add a lightweight incident log with a one-line postmortem for each outage, so patterns across incidents become visible over months, not just individual failures. For a deeper look at instrumenting the enrichment layer specifically, see real-time B2B people enrichment.
Frequently Asked Questions
How is an internal status page different from a public one like Statuspage or Atlassian?
A public status page is a marketing and trust tool aimed at customers, showing aggregated up/down states. An internal GTM pipeline status page is a diagnostic tool for your own team, showing per-stage detail like API error rates, sync lag, and webhook delivery success so engineers and RevOps can pinpoint exactly which hop failed.
How often should health checks run?
Every one to five minutes for most GTM pipelines is enough granularity without overwhelming your storage or your API rate limits. High-volume stages like webhook delivery can run closer to real time, while lower-frequency jobs like a nightly CRM sync only need a check after each scheduled run completes.
Can I build this without a dedicated engineer?
Yes, for a v1. A spreadsheet with a scheduled script, or a no-code tool like Zapier logging each API response to Airtable, covers the basics. You'll want an engineer once you add alerting logic, historical uptime percentages, or checks across more than a handful of stages.
What if a vendor doesn't expose a status endpoint?
Poll a lightweight "canary" request instead — a cheap, low-cost API call you make on a schedule purely to measure response time and error rate. Datamagnet's credit balance endpoint is a low-cost example of a call you can poll safely without burning meaningful quota.
Is a paid observability tool worth it instead of building custom?
It depends on scale. Teams juggling many disparate tools already report real friction — 59% say managing too many separate observability tools is a top challenge (Splunk, "State of Observability 2025"), so a single lightweight internal page often beats bolting on another paid tool for a handful of GTM pipeline stages.
Build the Status Page Your GTM Team Actually Needs
An internal status page doesn't need to be elaborate to be useful — it needs to answer "is the pipeline working right now" faster than a rep can type a question in Slack. Map your stages, define a health check for each one, centralize the results, and route alerts so the page stays trusted instead of ignored. See the Datamagnet API reference to review base URLs, quotas, and authentication before you wire up your first health check.
Sources
- Validity, The State of CRM Data Management in 2025, retrieved 2026-09-16, https://www.validity.com/resource-center/the-state-of-crm-data-management-in-2025/
- Splunk (with Oxford Economics), The Hidden Costs of Downtime 2026, retrieved 2026-09-16, https://www.splunk.com/en_us/form/the-hidden-costs-of-downtime.html
- Splunk, State of Observability 2025, retrieved 2026-09-16, https://www.splunk.com/en_us/blog/observability/state-of-observability-2025.html
- Uptime Institute, Annual Outage Analysis 2025, retrieved 2026-09-16, https://uptimeinstitute.com/about-ui/press-releases/uptime-announces-annual-outage-analysis-report-2025
- Catchpoint, The SRE Report 2025, retrieved 2026-09-16, https://www.catchpoint.com/press-releases/the-sre-report-2025-highlighting-critical-trends-in-site-reliability-engineering
- Postman, 2025 State of the API Report, retrieved 2026-09-16, https://www.postman.com/state-of-api/2025/
- Datamagnet, Security & Data Practices, retrieved 2026-09-16, https://www.datamagnet.co/security/
