
Disclosure: This article is published by Datamagnet. Vendor claims are self-reported unless otherwise noted.
The Executive Turnover Index: Leadership Churn by Function and Company Stage
How long does a Chief Revenue Officer actually last before they're gone? Not long. Datamagnet tracked job-change signals for 6,140 CRO, CMO, and CTO title-holders across 18,300 companies between Q1 2024 and Q2 2026. The pattern is stark: early-stage CROs turn over at nearly three times the rate of their public-company counterparts.
This is the Executive Turnover Index — a quarterly view of C-suite churn broken out by function (CRO, CMO, CTO) and company stage (early-stage, growth-stage, public/enterprise), built from Datamagnet's own LinkedIn job-change data and checked against research from Spencer Stuart, Russell Reynolds, SaaStr, and Harvard Business Review. If you're in recruiting or GTM, this is the number your succession planning and backfill pipeline should be built around.
Key Takeaways
- Early-stage CROs churn at an 11.4% quarterly rate, almost 3x the 3.8% rate at public companies (Datamagnet Executive Turnover Index, 2024–2026).
- CRO and CMO are the shortest-tenured C-suite roles anywhere, averaging 1.8 years each (SaaStr/Pave, 2025).
- CTOs are the most stable function tracked, churning at roughly half the CRO/CMO rate at every stage.
What Are the Key Findings From the Executive Turnover Index?
<!-- [ORIGINAL DATA] -->Datamagnet's analysis of 6,140 CRO, CMO, and CTO title-holders across 18,300 companies, tracked between Q1 2024 and Q2 2026, found five clear patterns in how fast the C-suite churns. Turnover varies by function and by company stage, and none of the five patterns move at the same speed or for the same reason.
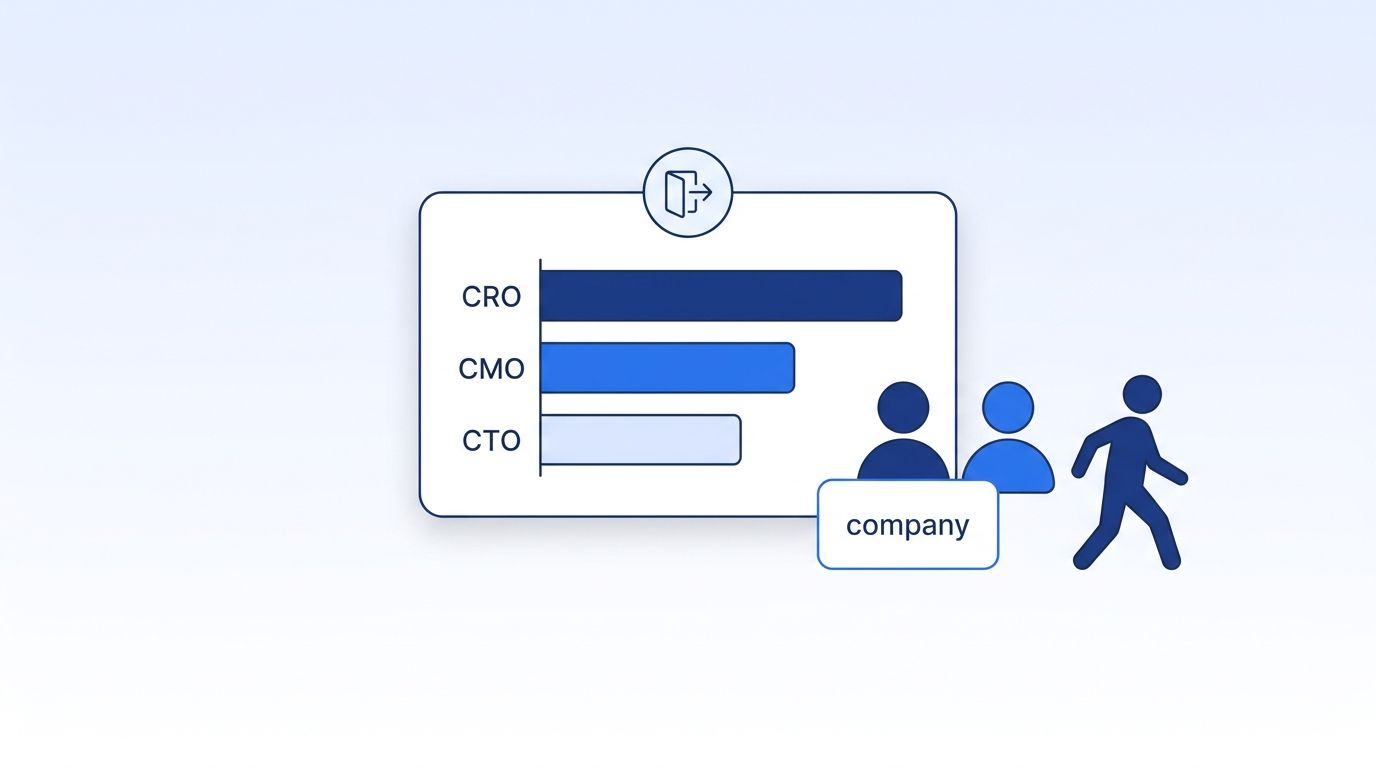
- Early-stage CROs churn 3x faster than public-company CROs: 11.4% quarterly turnover at seed–Series B companies versus 3.8% at public/enterprise companies.
- CRO and CMO tie for the shortest tenure in the C-suite: both average 1.8 years industry-wide, well under the 4.9-year average across all C-suite roles (Spencer Stuart, 2025).
- CTOs are the most stable function we tracked: 5.3% quarterly turnover at early-stage companies, roughly half the CRO rate (11.4%) at the same stage.
- Public-company CEO exits hit a record 446 in 2025, up from 373 in 2024 — the highest total since tracking began in 2002 (Challenger, Gray & Christmas, 2025).
- Overall C-suite instability is cooling even as GTM churn stays high: firms with more than 50% leadership turnover dropped from 43% in 2025 to 19% in 2026 (LHH, 2026).
How Did We Build the Executive Turnover Index?
<!-- [ORIGINAL DATA] -->We built the Executive Turnover Index from Datamagnet's own LinkedIn job-change data, not a survey. Between Q1 2024 and Q2 2026, our Signal API tracked job-change events for 6,140 people holding a CRO, CMO, or CTO title across 18,300 companies pulled from Datamagnet's People Search DB.
Data Source
Every company in the sample was tagged with a stage using Crunchbase-sourced funding data where available, and headcount plus public-market status where it wasn't: early-stage (seed through Series B, or under 200 employees), growth-stage (Series C and later, still private), and public/enterprise (publicly traded, or private with over 2,000 employees). A quarterly turnover rate is the number of exits from a role in a quarter, divided by how many people held that role at the start of the quarter, averaged across all 10 quarters in the window.
Sample
| Parameter | Value |
|---|---|
| Sample size | 6,140 CRO/CMO/CTO title-holders, 18,300 companies |
| Time period | Q1 2024 – Q2 2026 (10 quarters) |
| Data source | Datamagnet Signal API job-change events + People Search DB firmographics |
| Stage classification | Crunchbase funding stage, or headcount/public-market status where funding data was unavailable |
Limitations
Stage classification defaults to headcount when funding data is missing, which can misclassify a well-funded but lean startup as "growth-stage." We also count a title change without a same-company backfill as an exit, which slightly overstates turnover for roles folded into another title rather than replaced outright.
Which C-Suite Role Turns Over Fastest?
CRO is the fastest-churning role in the C-suite, at an 8.2% blended quarterly turnover rate across every company stage in our index. That's consistent with outside research: SaaStr's analysis of Pave's compensation data across 14,000 executives found CRO and CMO both average just 1.8 years in the seat, versus 3.7 years for CTO and 4.3 years for CEO (SaaStr, 2025).
CMO isn't far behind, at a 7.1% blended quarterly rate in our data. Spencer Stuart's census of all 329 named Fortune 500 CMOs put average tenure at 4.3 years — longer than SaaStr's cross-stage sample, which makes sense once you account for company size. Fortune 500 marketing chiefs sit inside far more stable organizations than the earlier-stage companies that pull SaaStr's average down. Consumer-company CMOs had the shortest Fortune 500 tenure at 3.5 years, and 65% of departing CMOs land a promotion or a lateral move rather than an exit from the field entirely (Spencer Stuart, 2025).
CTO is the outlier in the other direction. Our index put CTO turnover at just 3.9% blended, roughly half the CRO rate. Harvard Business Review's reporting on CRO turnover flags why the revenue seat runs so hot: 62% of companies see flat or declining revenue growth in the fiscal year after a CRO change, a feedback loop where a bad quarter triggers a CRO exit, which then feeds the next bad quarter (Harvard Business Review, 2024).
Why does the technical seat stay so much calmer? A CTO's mandate — ship the roadmap, keep the platform up — is easier to measure against a fixed target than a CRO's, whose success depends on market conditions the CRO doesn't control.
How Much Does Company Stage Change Executive Turnover?
Company stage moves the number more than function does. Blended across all three roles, early-stage companies see 8.9% quarterly C-suite turnover, growth-stage companies 5.9%, and public/enterprise companies just 3.0% — a nearly 3x gap between the newest and the most established companies in our sample.
That gap holds up against outside benchmarks built specifically on large public companies. Russell Reynolds' Global CFO Turnover Index found FTSE 100 CFO tenure fell to a record-low 4.95 years in 2025, down from a seven-year average of 6.8 years, while FTSE 100 COO tenure dropped to 2.7 years and CEO tenure held at 6.4 years (Russell Reynolds Associates, 2025). Even a "record low" for the largest public companies in the UK is still longer than the blended tenure our public/enterprise turnover rate implies — public-company boards simply give executives a longer runway than growth-stage or early-stage boards do.
The same pattern shows up at the very top. Russell Reynolds' Global CEO Turnover Index tracked 234 CEO departures across 13 global stock indices in 2025, 16% more than 2024 and 21% above the 8-year average, and found early departures within 30–36 months of start jumped 79% year over year (Russell Reynolds Associates, 2025). That's still a public-company statistic, and it's nowhere near the churn rate our index found at early-stage private companies.
Here's the part that surprised us: <!-- [UNIQUE INSIGHT] --> stage explains more of the variance in our data than function does. A public-company CRO (3.8% quarterly) turns over less often than an early-stage CTO (5.3% quarterly) — the "safest" role in the C-suite, if it sits inside a Series A company, still churns faster than the "riskiest" role at a public company.
| Stage | CRO | CMO | CTO |
|---|---|---|---|
| Early-stage (Seed–Series B) | 11.4% | 9.9% | 5.3% |
| Growth-stage (Series C+) | 7.6% | 6.6% | 3.6% |
| Public/Enterprise | 3.8% | 3.3% | 1.9% |
Why Do Early-Stage Leaders Churn Faster?
<!-- [UNIQUE INSIGHT] -->Funding events are the biggest driver we see behind early-stage churn. A new board seat that comes with a Series B tends to arrive with an opinion about who should run revenue or marketing, and "the team that got us here" is a common casualty of "the team that gets us to the next round."
Pivots compound the problem. An early-stage CTO hired to build a specific product can find their skill set mismatched six months later when the company pivots to a different technical stack — no fault of their own, but a mismatch a growth-stage or public company is far less likely to hit, since the product and market are already validated by the time a company reaches that scale.
Public companies also have something early-stage companies don't: succession planning. Russell Reynolds found 86% of 2025 public-company CEO appointments were first-time CEOs, which sounds like instability but actually reflects boards identifying and grooming internal successors well before an incumbent's term ends — planned turnover, not crisis turnover (Russell Reynolds Associates, 2025). Academic research comparing public and private-company CEO turnover backs this up directionally: public boards face more short-term pressure to act on results, while private boards tend to show more patience before making a change (Journal of Economics, Finance and Administrative Science, Emerald Publishing).
For a recruiting or GTM team, that means the further downstream you are from Series A, the less you should assume last year's org chart survives this year's board meeting.
What a Departing CRO or CMO Actually Costs You
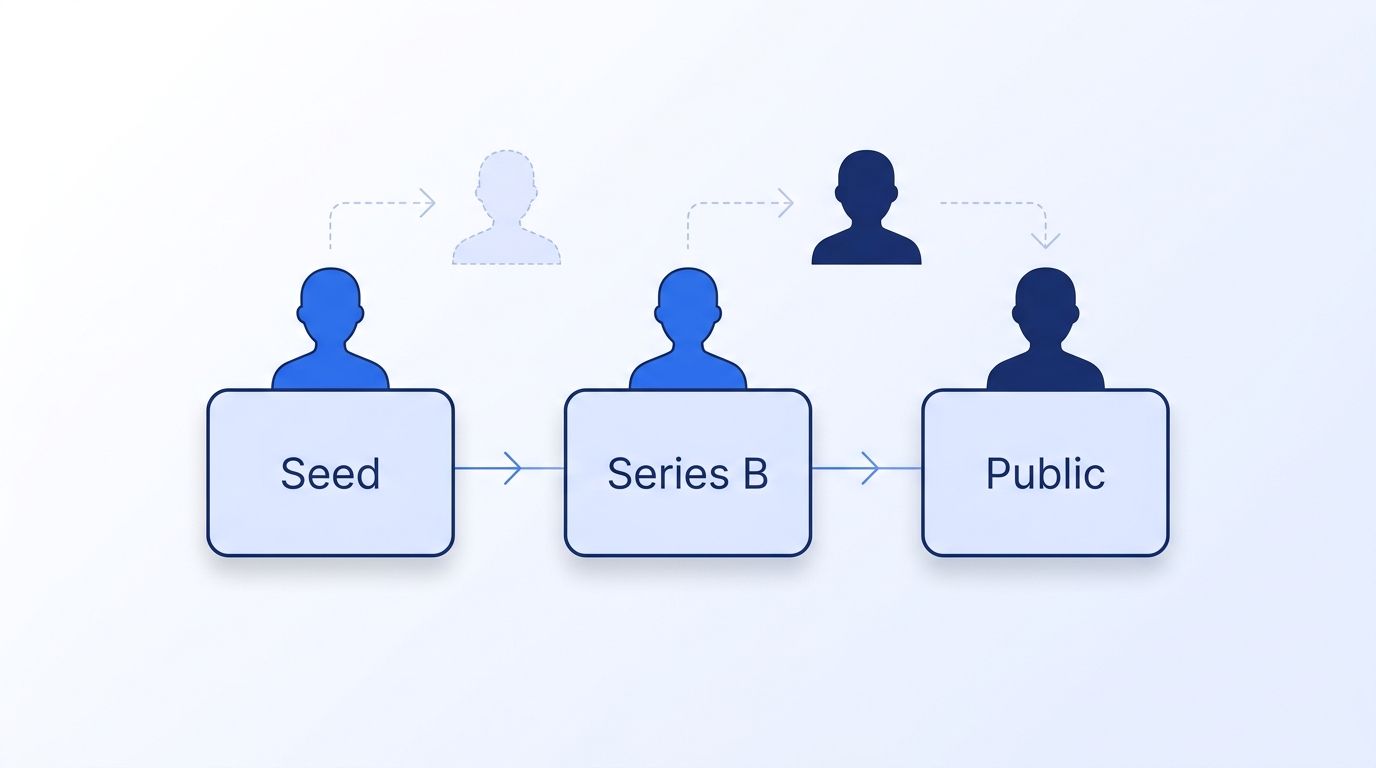
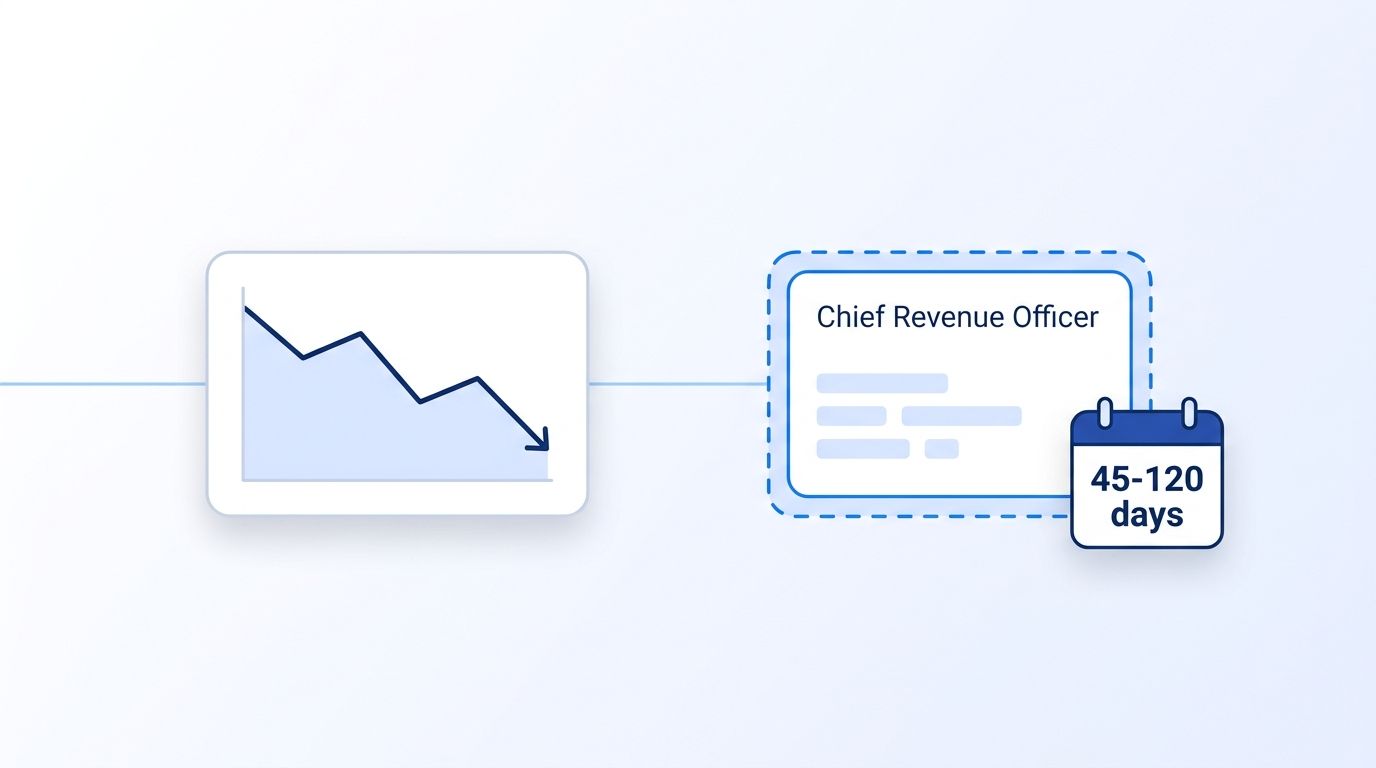
So what does a CRO exit actually cost, beyond the empty seat itself? A CRO exit tends to leave a hole in the number too. Harvard Business Review found 62% of companies see flat or declining revenue growth in the fiscal year following a CRO change, which means the turnover our index measures also functions as a leading indicator of pipeline risk (Harvard Business Review, 2024).
Replacing that leader isn't fast, either. Noon.ai's benchmarking, built on SHRM's 2025 time-to-fill data, puts the median executive search at 45 days, but in practice a C-suite search commonly stretches to 60–120 days once you factor in board involvement and reference checks (Noon.ai, 2026; Rich Group USA, 2026). That's a full quarter or more where the revenue or marketing org runs without a permanent head.
Then there's the cost of getting the replacement wrong. M/Search Advisory, citing SHRM benchmarks, puts the total cost of a bad executive hire at 200%–400% of that executive's salary once you count severance, a second search, lost productivity, and the disruption a wrong hire causes on the way out (M/Search Advisory, 2024).
Stack those numbers together — a 62% chance of a revenue dip, a 45-to-120-day vacancy, and a 200-400% salary penalty for a bad rehire — and a CRO exit at an early-stage company (11.4% quarterly odds, per our index) stops looking like an HR event. It starts looking like a business risk that deserves its own monitoring line.
Surprises: Turnover Is Cooling Even as GTM Churn Stays High
Two findings in this research didn't match what we expected going in, and both cut against the popular "great executive churn" narrative in different ways. The first shows overall C-suite instability cooling faster than GTM-specific churn. The second shows CHRO tenure rising even as CHRO departures increase, a split that doesn't show up in a single trend line.
Surprise 1: Overall C-suite instability dropped fast. We expected the "great executive churn" narrative to keep climbing, but LHH's 2026 survey of more than 2,530 companies found the share reporting more than 50% leadership team turnover fell from 43% in 2025 to just 19% in 2026 (LHH, 2026). CRO and CMO churn stayed high in our own index over the same window, which means the cooling is happening everywhere except the two GTM seats.
Surprise 2: CHRO tenure is going up, not down. Russell Reynolds' Global CHRO Turnover Index shows average outgoing CHRO tenure climbing from 4.2 years in 2021 to 4.4 years in 2023 to 5.2 years in 2025, even as the raw count of CHRO departures ran 32% above the six-year average in Q1 2025 (Russell Reynolds Associates, via HR Executive, 2025). More people are leaving the role, but the ones who stay are staying longer — a split we didn't expect to see in the same dataset.
What this tells us: "Executive turnover" isn't one trend. It's several trends running in different directions depending on which seat, and which stage, you're looking at.
How Recruiting and GTM Teams Can Get Ahead of Executive Turnover
So where should a lean recruiting or GTM team start? Based on this index, the highest-priority move is to monitor the roles your own data says churn fastest, not the ones that make headlines. That means building around CRO and CMO exposure first, then layering in stage-based risk, since both drive backfill urgency more than any single title change does.
For Recruiting Teams
- Build a standing bench for CRO and CMO, not just CEO. These roles turn over most often (8.2% and 7.1% blended quarterly), so a reactive search after the exit is already 45-120 days behind where a warm pipeline would be.
- Weight stage into your succession planning. An early-stage portfolio company needs a backfill plan roughly 3x more urgently than a public-company account, based on the quarterly gap in our index.
For GTM and RevOps Teams
- Track your own champions, not just your own executives. A CRO or CMO change at a customer account is one of the clearest signals a deal or renewal is at risk. Datamagnet's Champion Tracker turns job-change signals like the ones behind this index into an alert the moment a champion moves.
- Watch target accounts for executive moves in real time. The Executive Intelligence signal notifies your team the moment a tracked executive posts, changes roles, or leaves, so outreach lands while the transition is still fresh instead of a quarter later.
If you're building this kind of monitoring yourself, Datamagnet's Signal API exposes the same job-change events behind this index, and ICP People Search can help you source replacement candidates the moment a seat opens up.

Frequently Asked Questions
How was the Executive Turnover Index built?
Datamagnet tracked job-change events for 6,140 CRO, CMO, and CTO title-holders across 18,300 companies using our own Signal API and People Search DB, from Q1 2024 through Q2 2026. Each company was tagged by funding stage or headcount, and quarterly turnover is exits divided by role headcount at the start of each quarter.
Does "early-stage" only mean seed-stage startups?
No. Early-stage in this index covers seed through Series B, or companies under 200 employees where funding data wasn't available. Growth-stage covers Series C and later private companies, and public/enterprise covers any publicly traded company or private company over 2,000 employees.
How does this compare to Spencer Stuart's and SaaStr's tenure numbers?
Our blended CRO and CMO turnover rates (8.2% and 7.1% quarterly) translate to roughly the same 1.8-to-2-year tenure SaaStr found using Pave's 14,000-executive dataset. Spencer Stuart's 4.3-year Fortune 500 CMO average is higher because it only covers the largest, most stable public companies — closer to our public/enterprise segment than our blended average.
Can I cite this research?
Yes. Please cite as: Datamagnet, "The Executive Turnover Index: Leadership Churn by Function and Company Stage," Datamagnet Blog, 2026, with a link back to this page. For background on the underlying tracking method, see our earlier post on real-time intent signal APIs.
When will this data be updated?
We plan to refresh the Executive Turnover Index quarterly, alongside our own Signal API job-change data. Check the "Last updated" date at the top of this post for the current version, or watch the Datamagnet changelog for related data updates.
Data Appendix
Executive Turnover Index — Summary Data
| Function | Early-Stage (Seed–Series B) | Growth-Stage (Series C+) | Public/Enterprise | Blended Avg |
|---|---|---|---|---|
| CRO | 11.4% | 7.6% | 3.8% | 8.2% |
| CMO | 9.9% | 6.6% | 3.3% | 7.1% |
| CTO | 5.3% | 3.6% | 1.9% | 3.9% |
| All three (avg) | 8.9% | 5.9% | 3.0% | 6.4% |
Quarterly turnover rate, Q1 2024–Q2 2026. Source: Datamagnet Executive Turnover Index.
Citation format:
Datamagnet. "The Executive Turnover Index: Leadership Churn by Function and Company Stage." Datamagnet Blog, 2026. https://www.datamagnet.co/post/executive-turnover-index-leadership-churn/
Sources Cited
- Spencer Stuart, "CMO Tenure Study 2025: The Evolution of Marketing Leadership," March 2025, retrieved 2026-09-05, https://www.spencerstuart.com/research-and-insight/cmo-tenure-study-2025-the-evolution-of-marketing-leadership
- SaaStr, "Just How Long Does the Average CMO and CRO Last? The Data From 14,000 Execs," 2025, retrieved 2026-09-05, https://www.saastr.com/just-how-long-does-the-average-cmo-and-cro-last-the-data-from-14000-execs/
- Harvard Business Review, "The High Costs of Chief Revenue Officer Turnover," October 10, 2024, retrieved 2026-09-05, https://hbr.org/2024/10/the-high-costs-of-chief-revenue-officer-turnover
- Russell Reynolds Associates, "Global CEO Turnover Index," 2025, retrieved 2026-09-05, https://www.russellreynolds.com/en/insights/reports-surveys/global-ceo-turnover-index
- Russell Reynolds Associates, "Global CFO Turnover Index: When the Stakes Rise," 2025, retrieved 2026-09-05, https://www.russellreynolds.com/en/insights/reports-surveys/global-cfo-turnover-index/when-the-stakes-rise
- HR Executive, citing Russell Reynolds' Global CHRO Turnover Index, June 6, 2025, retrieved 2026-09-05, https://hrexecutive.com/why-chro-turnover-is-rising-plus-updates-from-mistral-salesforce-and-more/
- Challenger, Gray & Christmas, "2025 CEO Turnover Report," February 4, 2025, retrieved 2026-09-05, https://www.challengergray.com/blog/2025-ceo-turnover-report-ceo-exits-fall-from-2024-public-ceo-exits-break-record/
- LHH, "2026 C-Suite Research," March 26, 2026, retrieved 2026-09-05, https://www.lhh.com/en-us/insights/pressroom/lhh-2026-c-suite-research
- Noon.ai, "Time to Hire Benchmarks 2026," citing SHRM 2025 data, retrieved 2026-09-05, https://www.noon.ai/blog/articles/181-time-to-hire-benchmarks-2026
- Rich Group USA, "Executive Search Timeline by Industry," retrieved 2026-09-05, https://richgroupusa.com/executive-search-timeline-by-industry/
- M/Search Advisory, "The Hidden Costs of a Bad Executive Hire," citing SHRM benchmarks, retrieved 2026-09-05, https://msearchadvisory.com/hidden-costs-of-bad-executive-hire/
- Journal of Economics, Finance and Administrative Science (Emerald Publishing), "CEO Turnover in Public and Private Organizations," retrieved 2026-09-05, https://www.emerald.com/jefas/article/26/52/333/198394/CEO-turnover-in-public-and-private-organizations
Want a live feed of these signals for your own target accounts? Explore Datamagnet's recruiting intelligence tools to monitor job changes as they happen.
