
Disclosure: This article is published by Datamagnet. Vendor claims are self-reported unless otherwise noted.
Data Quality OKRs: What to Measure Beyond "Percent Complete"
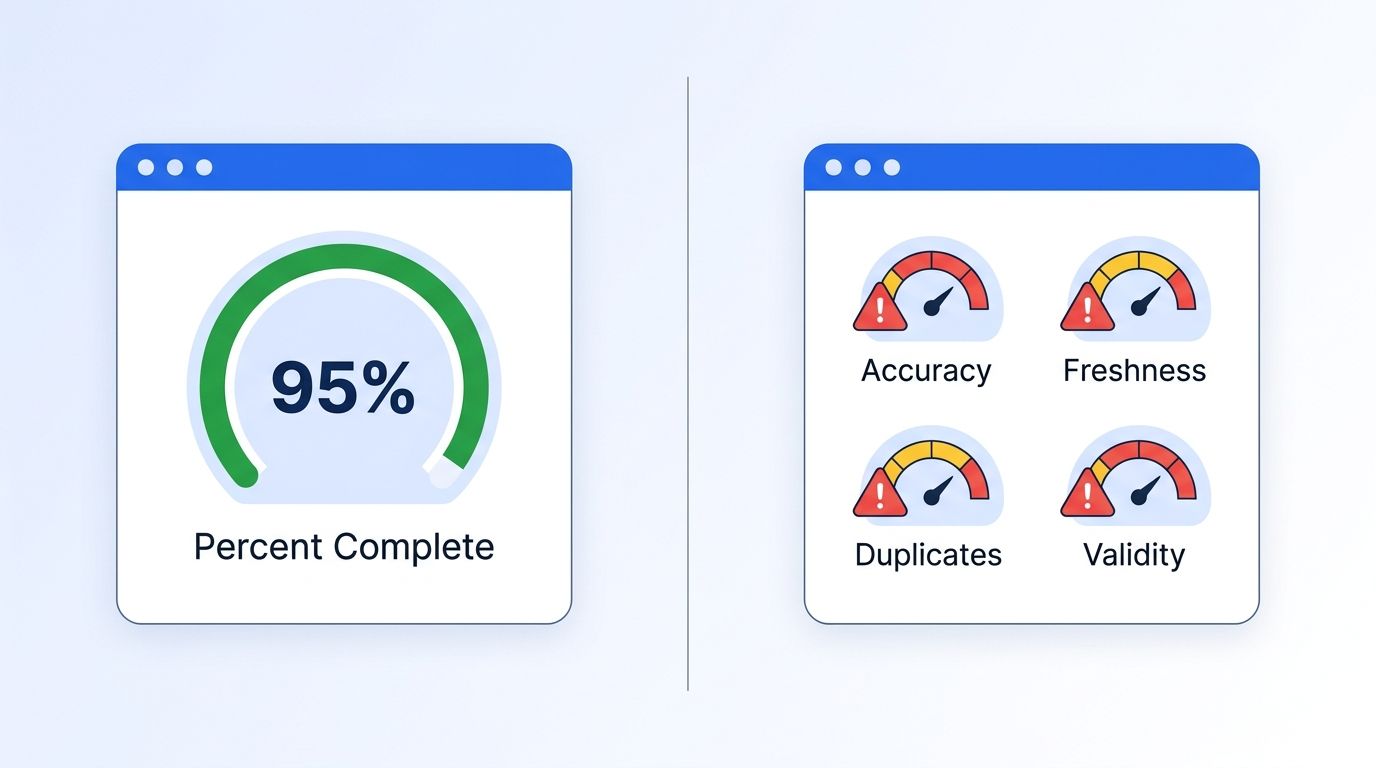
Seventy-six percent of organizations say less than half of their CRM data is accurate and complete, even after years of data quality initiatives (Validity, 2025). If your data quality OKR only tracks "percent of fields filled in," you can hit 95% completeness and still have a database full of garbage. This guide walks you through building data quality OKRs that measure whether your data is actually correct, current, and usable — not just filled in.
Most RevOps and data governance teams inherited a completeness metric from a spreadsheet someone built five years ago. It's easy to report and easy to game, which is exactly the problem. By the end of this guide, you'll have an OKR framework with objectives tied to business outcomes and key results your team can't fake by dumping placeholder text into a required field.
When we audited our own signal delivery pipeline at Datamagnet, completeness looked fine — every job-change alert had a name, a company, and a title. The problem showed up in freshness: a chunk of alerts referenced roles people had already left. Completeness told us nothing about that lag.
For a related foundation on why clean inputs matter before you automate anything downstream, see our guide on programmatic CRM enrichment.
TL;DR
- 76% of orgs say under half their CRM data is accurate (Validity, 2025) — completeness alone won't catch this.
- 37% of CRM staff admit to entering fake data just to pass validation checks (Validity, 2025), which is the core reason completeness-only OKRs fail.
- Replace or supplement completeness with accuracy, freshness, uniqueness, validity, and consistency key results, each with a named owner and review cadence.
- Tie every key result to a downstream business number — bounced emails, lost pipeline, or rep hours wasted — not just an internal quality score.
Why Does "Percent Complete" Fail as a Data Quality OKR?
A completeness score answers one question: are the fields filled in? It says nothing about whether a phone number still rings or a job title is still accurate. That gap is exactly why 37% of CRM staff admit to regularly entering fake or placeholder data just to satisfy validation rules or leadership pressure (Validity, 2025).
Think about what that means for your dashboard. A rep types "N/A" into a required industry field, or copies the company name into the phone field, and your completeness score climbs. Nothing about the data got better — you just taught your team to defeat the metric.
IBM's 2025 study of 1,700 senior data leaders found only 26% of Chief Data Officers are confident their data can support new AI-driven revenue initiatives, citing accuracy, completeness, integrity, and consistency as separate, unresolved barriers (IBM Institute for Business Value, 2025). Notice that completeness is just one item on that list, not the whole list.
What Do You Need Before Setting Data Quality OKRs?
You don't need a new data stack to start. You need visibility into what you're already tracking and the authority to change it: a look at your current data quality dashboard, the 3-5 fields your revenue team actually relies on, and a stakeholder from sales or marketing ops who can confirm what bad data costs them day to day.
- Access to your current CRM data quality dashboard (or the spreadsheet that plays that role today)
- A list of the 3-5 fields your revenue team actually relies on (title, company, email, phone, LinkedIn URL are common ones)
- One stakeholder from sales or marketing ops who can confirm what "bad data" actually costs them
- Time: about 60-90 minutes to draft the first version, then a recurring 30-minute quarterly review
- Difficulty: Beginner to Intermediate — no engineering work required to start
Step 1: What Does Your Current OKR Actually Measure?
By the end of this step, you'll know exactly which data quality dimension — or lack of one — your current OKR is tracking. Pull up your last two quarters of data quality reporting. Most teams find a single number: percent of required fields populated. Ask whether that number ever moved because someone fixed real data, or because someone padded a field to hit the target.
The tell is usually in the correlation. If your completeness score and your sales team's complaints about bad contact data move independently of each other, completeness isn't measuring the thing you actually care about.
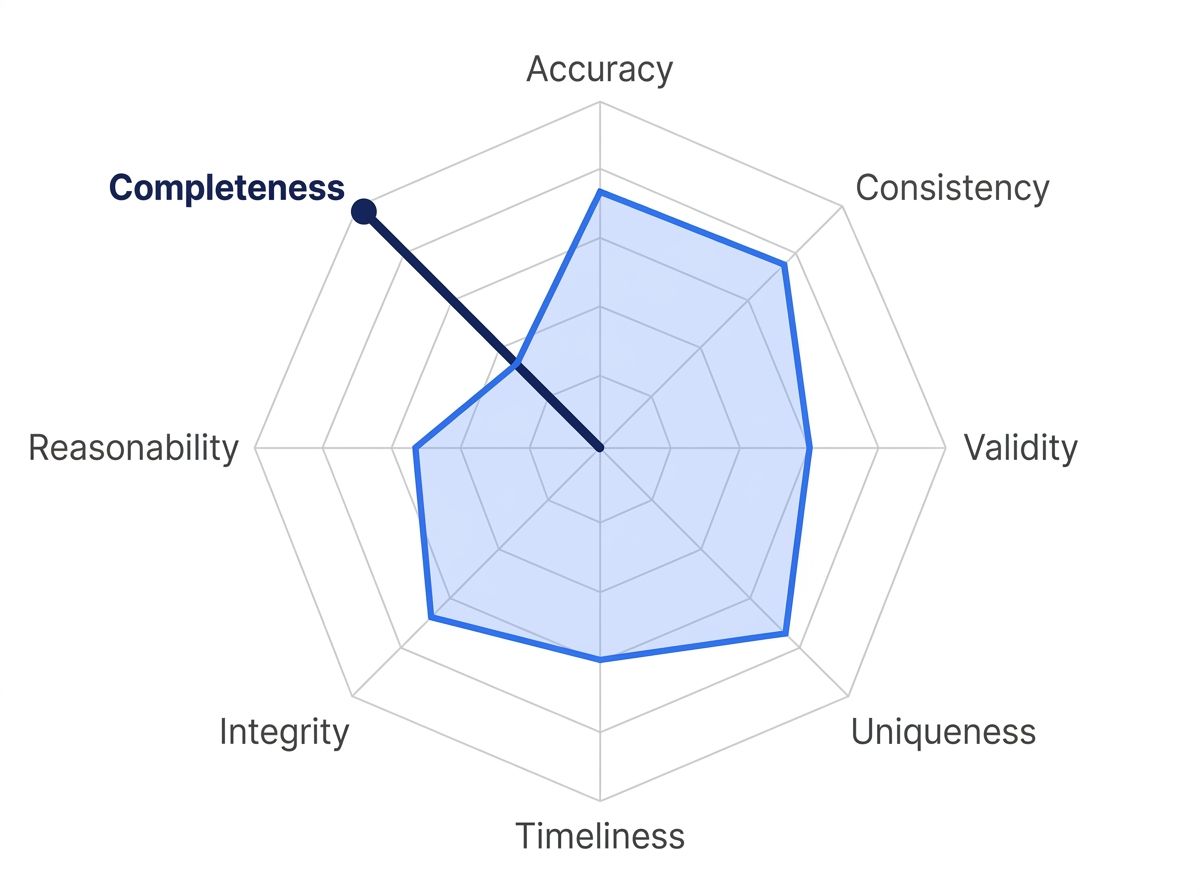
Cross-check the fields you audited against DAMA International's DMBOK framework, which defines data quality across roughly eight dimensions: accuracy, completeness, consistency, validity, uniqueness, timeliness, integrity, and reasonability. If your OKR only touches one of those eight, you have your gap.
Step 2: Which Dimensions Match Your Business Risk?
By the end of this step, you'll have 2-3 dimensions beyond completeness that map directly to a real business problem your team has. Don't try to instrument all eight DAMA dimensions in one quarter — that's a good way to ship nothing. Pick the ones tied to the failures you already hear about:
- Accuracy — is the value actually true right now? A title that's technically filled in but wrong is worse than blank, because reps trust it. Structured profile data, like the fields returned by a company profile lookup, gives you a source of truth to check accuracy against instead of trusting whatever a rep typed in manually.
- Timeliness/freshness — how old is this record, and does that matter for this field? A funding round from 18 months ago is stale in a way a founding date never is.
- Uniqueness — how many duplicate records exist for the same person or company, and are they splitting your engagement history across two rows?
Step 3: Write an Objective That Names the Business Outcome
By the end of this step, you'll have an Objective statement that a VP of Sales would actually care about — not just a data team. Skip "Improve data quality" as an Objective. It's vague and unmeasurable on its own. Instead, name the outcome: "Reps trust CRM data enough to act on it without double-checking manually" or "Marketing sends fewer emails to invalid or outdated addresses."
The single most important move here: write the Objective in the language of the team that suffers when data quality is bad, not in the language of the team that manages the database.
Step 4: Build 2-4 Key Results With Baselines and Cadences
By the end of this step, every Key Result under your Objective has a current baseline, a target, and a stated review cadence — no vague "improve" language allowed. Each Key Result needs four parts: the dimension, the baseline measurement, the target, and how often you'll recheck it. For example:
- Accuracy: Contact title accuracy rises from 68% to 90%, verified against live profile data monthly.
- Freshness: Median contact record age drops from 95 days since last verification to 30 days, reviewed monthly.
- Uniqueness: Duplicate contact rate for the same person drops from an audited baseline to under 5%, reviewed quarterly.
Freshness decays faster than most teams assume. Median U.S. employee tenure fell to 3.9 years in 2024, and workers aged 25-34 stay in a role just 2.7 years on average (U.S. Bureau of Labor Statistics, 2024) — every one of those moves makes a stored title, company, and reporting line wrong the day it happens. A job-change signal monitor is one way to catch that decay closer to the moment it occurs instead of finding out at your next quarterly audit.
Email is a useful proxy for how fast this compounds. Email databases degraded by at least 28% in a single year, with only 62% of addresses in one large verification run confirmed safe to send (ZeroBounce, 2025). If your freshness Key Result reviews annually instead of monthly, you're measuring last year's data quality, not this quarter's.
Step 5: Who Should Own Each Key Result?
By the end of this step, every Key Result has one named owner and one documented method for measuring it — not "the data team" as a group. A Key Result with no owner turns into a slide nobody updates. Assign a person, not a department, and write down exactly how the number gets pulled: a query, a dashboard, or an API check against a system of record like a structured person profile lookup. If checking a Key Result takes more than 15 minutes of manual work, automate it before your next review — otherwise it quietly stops happening.
For duplicate and uniqueness tracking specifically, searching your own enriched records through something like a people search database gives you a repeatable way to spot the same person entered under two different record IDs.
Step 6: How Do You Tie Results to Business Impact?
By the end of this step, your quarterly OKR review includes at least one business metric that isn't an internal data score. Data quality OKRs live or die on whether leadership sees the connection to revenue. Organizations reporting direct revenue loss from poor CRM data cited an average of 16 lost sales opportunities per quarter, and teams lose an average of 13 hours per week just hunting for accurate information inside the CRM (Validity, 2025). Report those alongside your accuracy and freshness numbers so the OKR review isn't just a data team meeting.
Account executives feel bad data first, since they're the ones building outreach lists from it — see our breakdown of account research infrastructure for how that research layer depends on the same accuracy and freshness assumptions.
What Mistakes Should You Avoid?
Most teams get stuck on the same four mistakes when they rewrite a data quality OKR for the first time: leaning on completeness alone, piling on too many Key Results, skipping an instrumentation plan, and ignoring the incentive problem that pushes reps to fake data in the first place. Each one is fixable once you know to look for it.
1. Keeping completeness as the only Key Result. It's the easiest mistake because completeness is the easiest thing to measure. Add at least one accuracy or freshness Key Result alongside it, not instead of a full rewrite — you likely still want completeness as one signal among several.
2. Setting too many Key Results. More than four dilutes focus and makes the quarterly review drag. Cap each Objective at 2-4 Key Results and retire one before adding another.
3. No instrumentation plan. A target without a repeatable measurement method turns into a guess every quarter. Decide how you'll pull the number before you finalize the target.
4. Ignoring the human incentive problem. If reps are penalized for incomplete records, some will fabricate values to avoid the penalty — which is exactly what happened at 37% of organizations surveyed by Validity in 2025. Fix the incentive, not just the metric.
What Does Success Look Like After a Quarter?
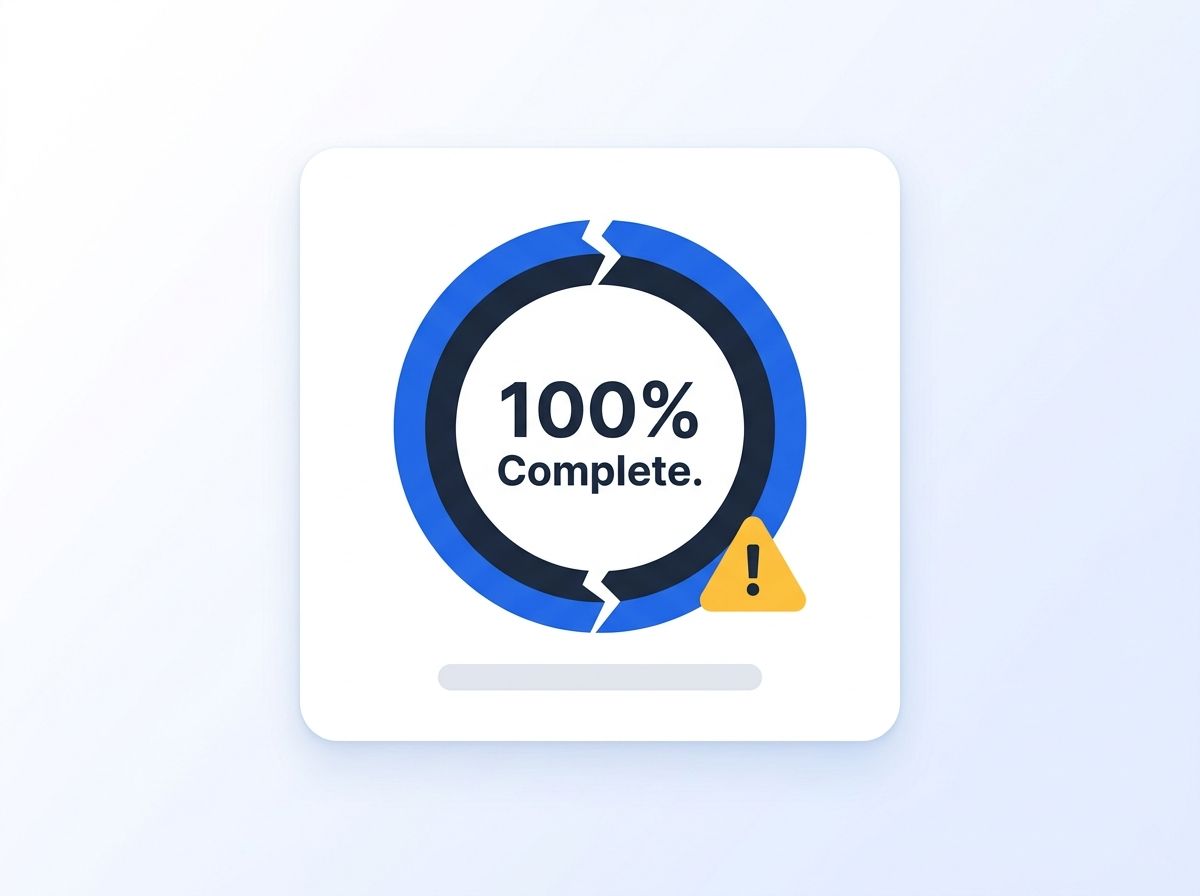
If everything went correctly, your data quality OKR review now includes at least three dimensions beyond completeness, each with a named owner, a documented baseline, and a business metric tied to it. You should see the accuracy and freshness numbers move first, since those are usually the most neglected. Duplicate rate tends to improve more slowly because it often requires a one-time cleanup project layered on top of the ongoing OKR. A good stretch goal for next quarter: connect your freshness Key Result to a continuously updated source, like a real-time B2B people enrichment API, so records refresh automatically instead of waiting for the next manual audit.
Ready to stop chasing a completeness score that doesn't reflect reality? See how fresh, structured company and people data can back your accuracy and freshness Key Results without a manual re-verification project every quarter.
Frequently Asked Questions
The questions below cover what teams ask most often when rebuilding a data quality OKR: what's wrong with completeness alone, which dimensions to add, how many Key Results to run, how often to review them, and how to tie the results to revenue. Each answer is self-contained and cites the same sourced data used throughout this guide.
What's wrong with using "percent complete" as a data quality OKR?
Completeness only checks whether a field has a value, not whether that value is correct or current. Because it's easy to game, 37% of CRM staff admit to entering fake data just to pass validation rules (Validity, 2025). Use it as one signal among several, not the whole OKR.
What data quality dimensions should replace or supplement completeness?
Start with accuracy, timeliness (freshness), and uniqueness, since those map most directly to sales and marketing pain points reps already complain about. DAMA International's DMBOK framework also names consistency, validity, integrity, and reasonability as additional dimensions worth tracking as your program matures.
How many key results should a data quality OKR have?
Cap each Objective at 2-4 Key Results. More than that dilutes focus during quarterly reviews and makes ownership harder to track. If you need to measure five or more dimensions, split them across two Objectives instead of one crowded one.
How often should you review data quality OKRs?
Review fast-decaying dimensions like freshness and accuracy every month, since B2B contact data can start degrading within weeks of a job change. Slower-moving dimensions like duplicate rate can usually run on a quarterly cadence instead, tied to your broader OKR review cycle.
How do you tie data quality OKRs to revenue, not just internal metrics?
Pair every data quality Key Result with a business-side number, like lost pipeline or wasted rep hours. Organizations reporting revenue loss from bad CRM data cited an average of 16 lost opportunities per quarter (Validity, 2025) — cite a number like that alongside your quality score so leadership sees the connection.
Conclusion
A completeness-only OKR tells you a field got filled in, not that your data is trustworthy. Rebuilding your data quality OKR around accuracy, freshness, uniqueness, and a tied business metric gives your team a target that's harder to fake and easier to defend in a leadership review. Our security and data practices page covers the trust and compliance side of keeping that data reliable at the source.
Start small: pick one dimension beyond completeness, assign one owner, and add it to next quarter's OKR review. For more on keeping the underlying data itself fresh, see our guide on real-time B2B people enrichment.
