
Disclosure: This article is published by Datamagnet. Vendor claims are self-reported unless otherwise noted.
How to Build a Talent Sourcing Signal Dashboard for Technical Recruiters
Median time-to-fill for nonexecutive roles hit 39 days in 2026, and technical roles routinely run longer (SHRM, 2026). If your team is still scrolling LinkedIn manually to spot who just changed jobs or picked up a new skill, you're losing candidates to recruiters who automated that step months ago.
A talent sourcing signal dashboard fixes this by pulling job-change events, engagement activity, and skill updates into one scored, filterable view. This guide walks through the six steps to build one, from defining which signals matter to wiring up real-time alerts your team will actually use.
In conversations with technical recruiting teams evaluating Datamagnet's signal API, the same complaint comes up first: they don't lack candidate data, they lack a way to know when a passive candidate becomes reachable. A dashboard built around signals, not static profiles, is what closes that gap.
For a foundational look at how signal APIs work before diving in, see our guide to real-time job-change signal APIs.
Key Takeaways
- Time-to-fill for nonexecutive roles rose 37% between 2022 and 2025 — from 43.64 to 59.67 days (Greenhouse, 2026).
- 46% of developers aren't actively job hunting, but most of that group is still open to the right approach (Stack Overflow, 2025).
- A signal-first dashboard (job changes, engagement, skill updates) beats manual profile scrolling because it tells you when to reach out, not just who to contact.
- Build order matters: define signals first, connect data sources second, score before you alert — skipping straight to alerts creates noise recruiters ignore.
What Do You Need Before You Start?
You don't need a data engineering team to build a working version of this. Recruiters now handle 746 applications a year on average, up from 146 in 2022 (Greenhouse, 2026), and no team scales that manually. You need three things in place before Step 1: a signal API, somewhere to store records, and a channel your recruiters already check.
- A signal or intent-data API that covers job changes, LinkedIn engagement, and profile updates (not just static contact records)
- A place to store and query candidate + signal records — a spreadsheet works for a pilot, a lightweight database (Airtable, Postgres) for anything beyond 500 candidates
- A destination for alerts your recruiters already check daily — Slack, email digest, or your ATS
Time to build a working v1: roughly 1-2 weeks for a small technical recruiting team. Difficulty: Intermediate — no coding required for the pilot version, light scripting helps for scale.
Step 1: Which Signals Actually Predict a Good Technical Hire?
By the end of this step, you'll have a short, ranked list of signal types worth tracking — instead of trying to monitor everything at once. Most teams fail here by treating every LinkedIn update as equal, which buries the signals that matter under noise.
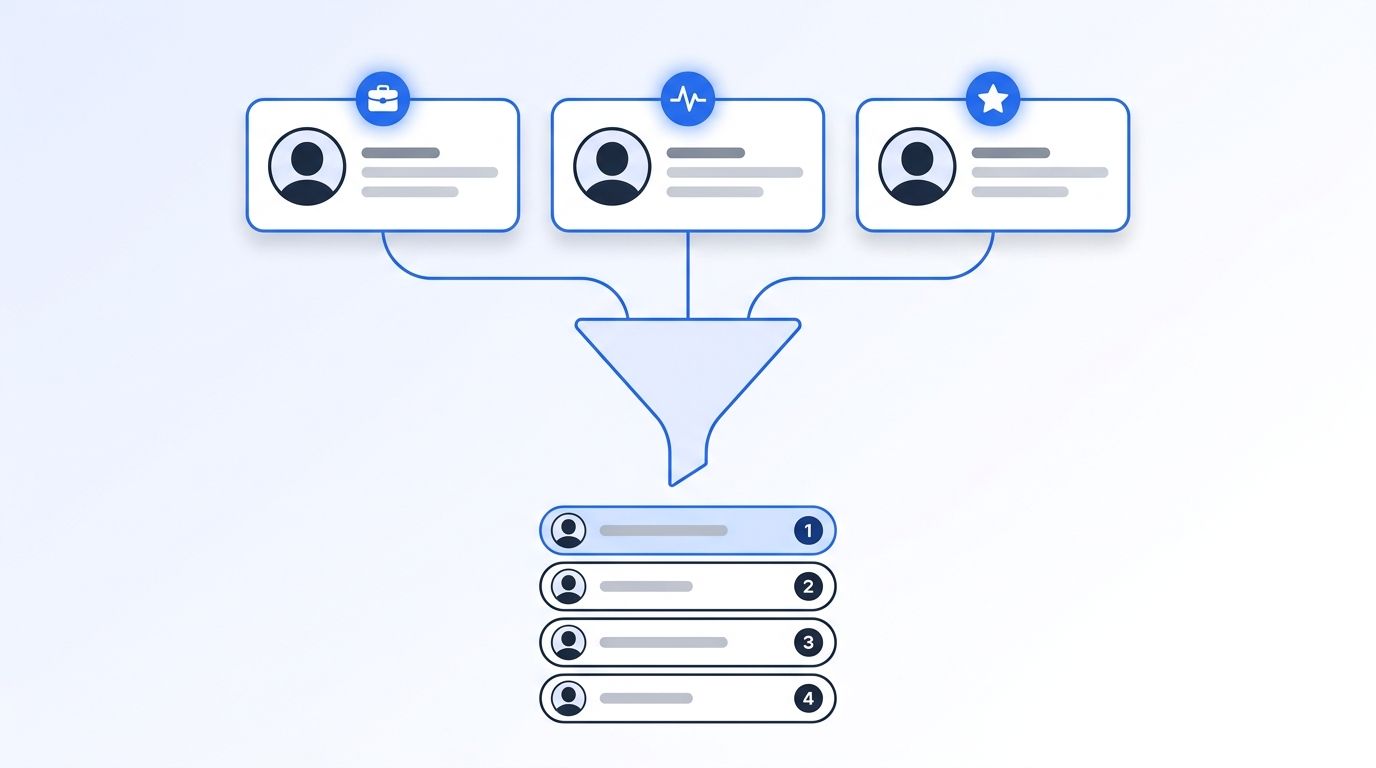
Start with three signal categories that map to hiring readiness:
- Job-change signals — a candidate updates their current role, which historically correlates with openness to new conversations
- Engagement signals — a candidate posts, comments, or reacts to hiring-adjacent or industry content
- Skill and profile-update signals — a candidate adds a certification, new tech stack, or updates their headline
69% of organizations report difficulty recruiting for full-time roles in 2025, with 51% citing low applicant volume and 50% citing competition from other employers (SHRM, 2025). Signal-based sourcing exists specifically to counter that — it surfaces candidates before a job posting goes live and before your competitors reach them.
Verification: you should be able to write one sentence per signal type explaining what action it triggers. If you can't, the signal is too vague to build a dashboard column around.
To start tracking these programmatically, create a signal monitor for each candidate segment you're prioritizing.
Step 2: How Do You Connect Your Signal Data Sources?
By the end of this step, your dashboard has a live feed instead of a manual export. This is the step most teams underestimate — connecting one API once is easy, keeping the connection reliable at scale is where projects stall.
Applications per recruiter rose 412% between 2022 and 2025, from 146 to 746 per year (Greenhouse, 2026). That volume makes manual sourcing math impossible; you need an API layer doing the first pass. Connect a data source that returns structured LinkedIn profile and activity data, not raw scraped HTML you have to clean yourself.
For structured profile and search data, query Datamagnet's People Search DB to pull enriched LinkedIn records without building your own scraper, then authenticate using the API quickstart guide.
Step 3: Design a Data Model That Scores Candidates, Not Just Lists You
By the end of this step, every candidate record has a structure that supports ranking, not just display. A list of names with signal tags isn't a dashboard — it's a spreadsheet with extra columns. The difference is a score field your team can sort by.
Keep the model to three linked objects: a candidate profile (name, role, company, LinkedIn URL), a signal event (type, timestamp, source), and a score (weighted sum of active signals). This keeps queries fast and keeps your dashboard filterable by signal freshness, not just candidate title.
Most sourcing dashboards fail not because the data is wrong, but because the schema treats every signal as permanent. A job-change signal from eight months ago shouldn't carry the same weight as one from eight days ago — build a decay function into the score, or your "hot" list quietly turns cold without anyone noticing.
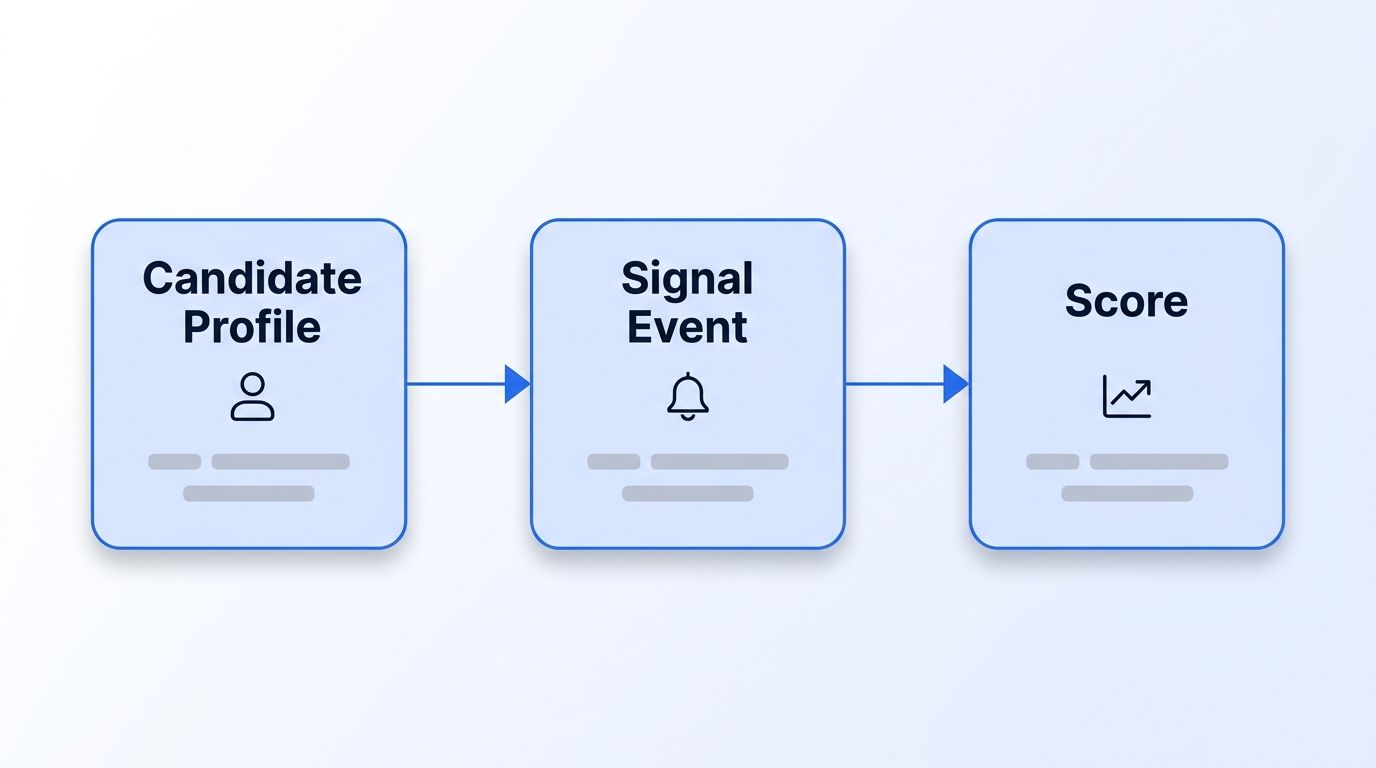
Use ICP People Search filters to pre-filter which candidate profiles enter your model in the first place — job title, seniority, and tech stack filters keep the dataset relevant instead of dumping every LinkedIn profile into your dashboard.
Step 4: How Do You Build the Prioritization Logic?
By the end of this step, your dashboard sorts candidates by likelihood-to-respond instead of alphabetically. This is the step that turns a data feed into an actual sourcing tool. Skip it, and even good signal data collapses back into a list your recruiters scroll top to bottom, missing the passive candidates further down who are actually more likely to reply.
46% of developers report they aren't actively job hunting, but within that group, 28.8% say they're "considering somewhat" and 14.8% "considering strongly" (Stack Overflow 2025 Developer Survey, 2025). That's the passive-candidate math your scoring logic needs to reflect — most of your addressable pool isn't actively searching, so your score should reward any recent signal of openness over raw seniority or title match alone.
To weight engagement activity specifically, pull data from the Person Engagement Signal endpoint, which tracks likes, comments, and shares on a candidate's LinkedIn posts as a proxy for active platform presence.
Step 5: How Do You Wire Up Real-Time Alerts?
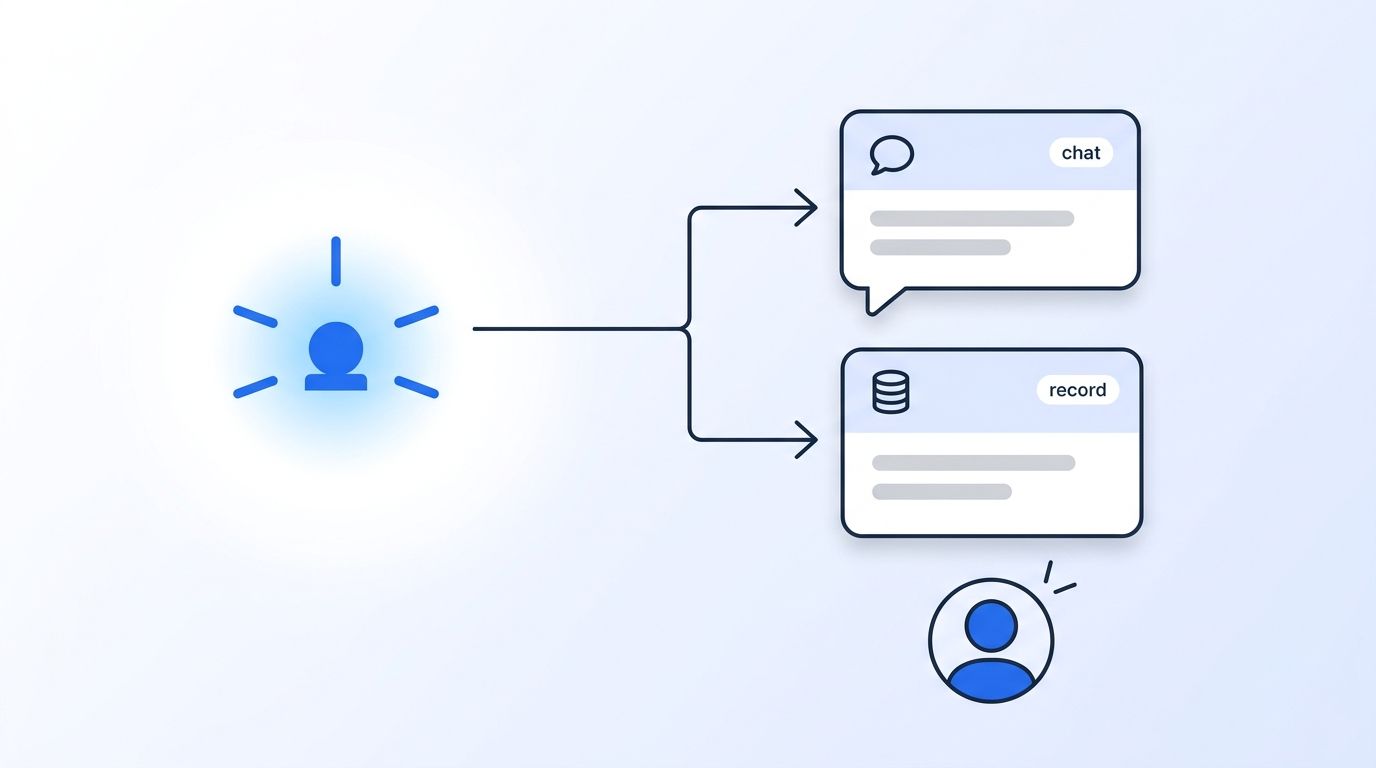
By the end of this step, a fresh signal reaches a recruiter's inbox or Slack within minutes, not during their next weekly dashboard check. A dashboard nobody opens daily isn't a sourcing tool, it's an archive. Since 46% of developers aren't actively looking in the first place (Stack Overflow, 2025), the window where a signal makes them reachable is often short, and a delayed alert means a missed one.
Companies using AI-assisted messaging report a 9% higher likelihood of a quality hire, and 61% of talent acquisition professionals believe AI improves how they measure quality of hire (LinkedIn Talent Solutions, The Future of Recruiting 2025). Real-time alerting is what makes that possible — it closes the gap between "a candidate became reachable" and "a recruiter reached out."
Route high-score signals through signed webhook payloads so your dashboard pushes alerts to Slack or your ATS instead of requiring recruiters to refresh a page.
Step 6: How Do You Test and Measure What the Dashboard Is Doing?
By the end of this step, you'll know whether the dashboard is improving reply rates or just adding a new tab your team ignores. Skipping measurement is the single most common reason sourcing tools get abandoned within a quarter. That's true even when every earlier step, from signal definition through alerting, was built correctly, because a dashboard's value only shows up in outcomes your team can measure.
The metric to watch isn't dashboard logins — it's reply rate on outreach triggered by a signal versus outreach sent cold. Vendor platform data from Pin's 2026 benchmark report, covering 4 million-plus messages, found cold email averaging a 4.96% reply rate against 17.08% for LinkedIn messages (Pin, Recruiting Outreach Benchmark Report 2026). Track your own signal-triggered outreach against that baseline for the first month.
Check the List Signals endpoint weekly to confirm which monitors are still active and firing — a signal that's gone quiet for weeks usually means the underlying profile changed or the monitor needs re-scoping.
What Mistakes Should You Avoid?
Most teams that abandon a signal dashboard within the first quarter make one of these four mistakes. With 69% of organizations reporting difficulty recruiting for full-time roles in 2025 (SHRM, 2025), there's little room for a dashboard that adds noise instead of signal. The four patterns below are the most common reasons teams stop trusting a sourcing dashboard within a quarter.
1. Treating every signal as equally urgent. Piping every job-change and engagement event into one undifferentiated feed trains recruiters to ignore the dashboard within a week. Score and rank before you alert.
2. Skipping signal decay. A profile update from six months ago isn't the same opportunity it was on day one. Build time-based scoring decay from Step 3, or your "priority" list fills with stale leads.
3. Building for volume instead of precision. With applications per recruiter up 412% since 2022 (Greenhouse, 2026), the instinct is to track more candidates. Track fewer, better-scored ones instead — a dashboard with 200 high-quality signals beats one with 5,000 unranked ones.
4. No feedback loop from outreach outcomes. If your dashboard doesn't record which signal-triggered messages got replies, you can't refine the scoring weights in Step 4. Log outcomes from week one.
What Does Success Look Like?
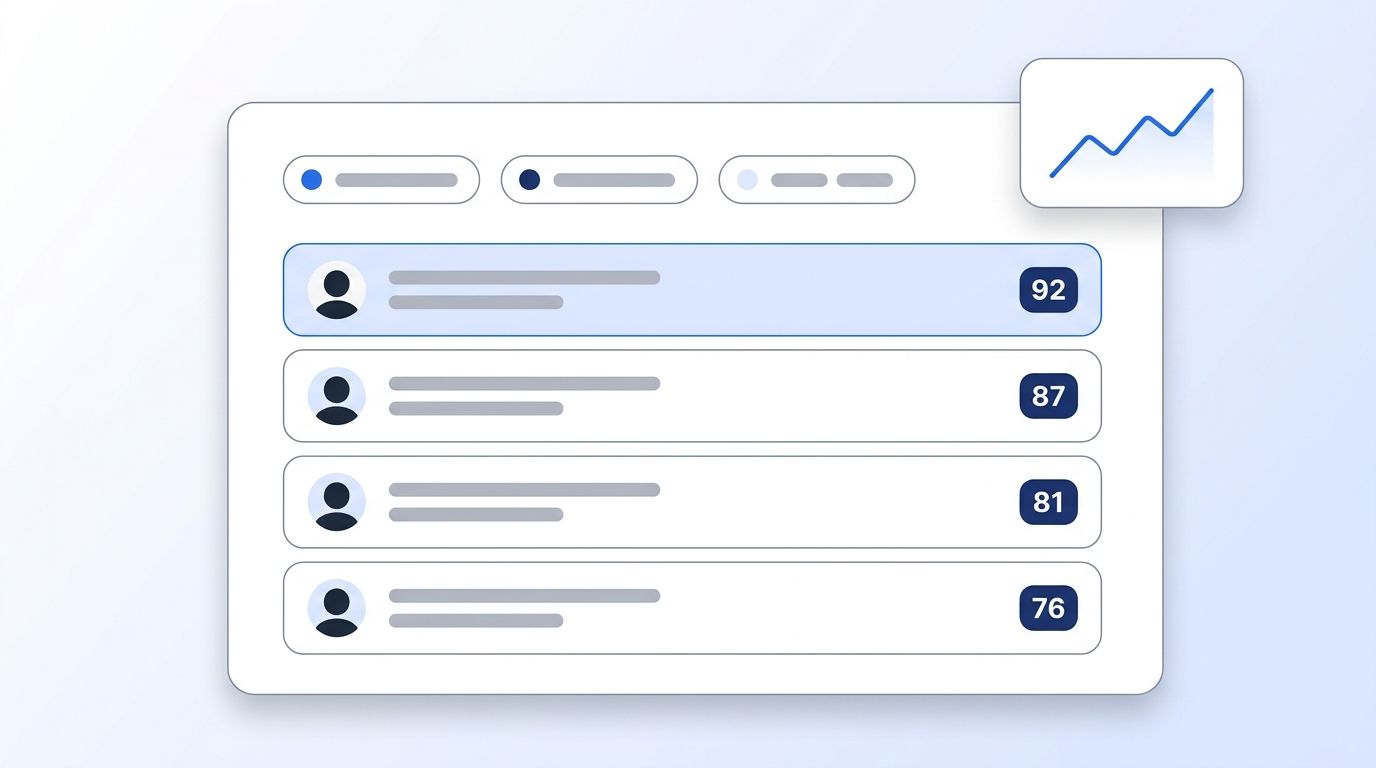
If you've followed all six steps, your dashboard should now show a ranked candidate list, refreshed automatically, with a visible signal type and timestamp on each entry. Recruiters should be able to filter by signal freshness and jump straight to outreach without a separate research step.
The metric that matters most in the first 30 days is reply rate on signal-triggered outreach compared to your team's historical cold-outreach baseline. Non-executive cost-per-hire averages $5,475 (SHRM, 2025) — even a modest reply-rate improvement compounds fast across a full requisition load.
Once your baseline dashboard is running, extend it toward long-term relationship tracking with our Champion Tracking playbook, which shows how to monitor a shortlist for job-change events long after an initial outreach attempt.
Frequently Asked Questions
The questions below cover the practical constraints teams hit first: build time, skill requirements, and how to know the dashboard is actually working. Median time-to-fill for nonexecutive roles is now 59.67 days (Greenhouse, 2026), and most of these answers assume you're trying to close that gap rather than build a perfect system on day one.
How long does it take to build a talent sourcing signal dashboard?
A working pilot version typically takes 1-2 weeks for a small technical recruiting team using an existing signal API, spreadsheet-based storage, and Slack alerts. Scaling to hundreds of tracked candidates with a proper database and decay-weighted scoring usually adds another 2-4 weeks.
Can I build this without an engineering team?
Yes, for a pilot. A recruiter comfortable with Airtable or a spreadsheet can connect a signal API, log events manually or via a no-code integration tool, and sort by a manual score column. Automated real-time alerts and decay-weighted scoring at scale generally need at least light scripting support.
What signals matter most for technical roles specifically?
Job-change and engagement signals tend to matter most, since 46% of developers aren't actively job hunting and rely on passive discovery (Stack Overflow, 2025). Skill and certification updates matter more for specialized roles where a new credential signals fresh market availability.
How do I know if my scoring logic is actually working?
Track reply rate on signal-triggered outreach against your team's cold-outreach baseline for at least 30 days. If signal-triggered messages aren't outperforming cold outreach, revisit your signal weighting from Step 4 before adding more data sources.
Is LinkedIn data alone enough, or do I need other sources?
LinkedIn-sourced signals (job changes, engagement, profile updates) cover most of what technical sourcing dashboards need, but pairing them with your ATS's historical outcome data closes the feedback loop described in the Common Mistakes section — without it, you're scoring candidates without ever confirming the score predicts anything.
Ready to Build Your Signal Layer?
You've now got a six-step path from raw LinkedIn activity to a scored, alert-driven sourcing dashboard. The teams that stick with this approach treat it as a living system — reweighting scores as reply-rate data comes in, not a one-time build.
Start by reading the API introduction to see the full range of signal and search endpoints available, then connect your first signal monitor against a live candidate segment.
