
Disclosure: This article is published by Datamagnet. Product capabilities described below are based on public documentation, retrieved 2026-08-06.
How to Prioritize Accounts With Multiple Overlapping Intent Signals
Your intent tool just flagged forty accounts this morning. A funding round here, a VP hire there, three LinkedIn engagement spikes, and a job change buried somewhere in the noise. Which one do you call first?
Most teams guess, and the guess is usually wrong. In 2026, only 26% of flagged intent signals ever convert into a qualified opportunity, and 87% of organizations say their intent data is unreliable or inflated (DemandScience, 2026 State of Performance Marketing Report). This guide gives you a repeatable framework for scoring, stacking, and routing overlapping signals so your reps stop guessing and start working the accounts that are actually ready to buy.
TL;DR
- In 2026, 87% of organizations call their intent signals unreliable, and only 26% of flagged signals convert (DemandScience, 2026) — volume alone isn't a prioritization strategy.
- Accounts prioritized with intent data convert to closed opportunities at 21.3%, versus 8.4% for non-prioritized accounts (Forrester via The Starr Conspiracy, 2025).
- Not every signal predicts the same. A recent VP hire, funding round, or 20%+ headcount jump each independently correlate with more software purchases in the following months (Bloomberry, 2025).
- Weight signals by predictive strength, stack overlapping ones into a single composite score, and set a response-time SLA tied to score tier — speed matters as much as the score itself.
What Do You Need Before You Start?
You don't need a data science team to build this framework, but you do need a few things in place: a defined ICP, at least two live signal sources, somewhere to store scores, and webhook or API access so those scores update automatically. Budget roughly 2-3 hours to build the first version of the rubric, then about 30 minutes a week to keep it current — the list below covers each requirement in detail.
- A defined ICP — job title, seniority, industry, headcount, and location filters that tell you which accounts are even worth scoring.
- At least two signal sources — job changes, funding rounds, hiring activity, or LinkedIn engagement (post, comment, or profile-level).
- A place to store scores — a CRM field, a spreadsheet, or a scoring table in your data warehouse works for a first pass.
- Webhook or API access to your signal provider so scores can update without someone refreshing a dashboard.
- Time: roughly 2-3 hours to build the first version of the rubric; ongoing maintenance is closer to 30 minutes a week.
- Difficulty: Intermediate.
Step 1: Which Signal Sources Are Feeding Your Pipeline?
By the end of this step, you'll have a single inventory of every signal type reaching your team, instead of five tools nobody fully trusts. That inventory should cover job-change alerts, funding databases, hiring and headcount trackers, LinkedIn engagement, keyword or competitor mentions, and website visitor data, with a note on what each one detects, how fresh the data is, and whether it fires at the person level, the company level, or both.
Start by listing every signal source in play: job-change alerts, funding databases, hiring/headcount trackers, LinkedIn post and comment engagement, keyword or competitor mentions, and website visitor data. Most teams are surprised how many they already have and how little any one rep can act on manually. Forrester's most recent market evaluation assessed 15 significant B2B intent-data providers across 21 separate criteria (Forrester Wave: Intent Data Providers for B2B, Q1 2025, 2025) — a market that keeps splintering into more tools, not fewer.
For each source, write down what it actually detects, how fresh the data is, and whether it fires at the person level, the company level, or both. A job-change signal tracks an individual; a company engagement signal tracks activity from an entire target account. You'll need both categories mapped before you can stack them against the same company record.
Verification: you're done when you can list every signal type, its source, and its granularity on one page — no tool left unaccounted for.
Step 2: How Should You Weight Each Signal by Predictive Strength?
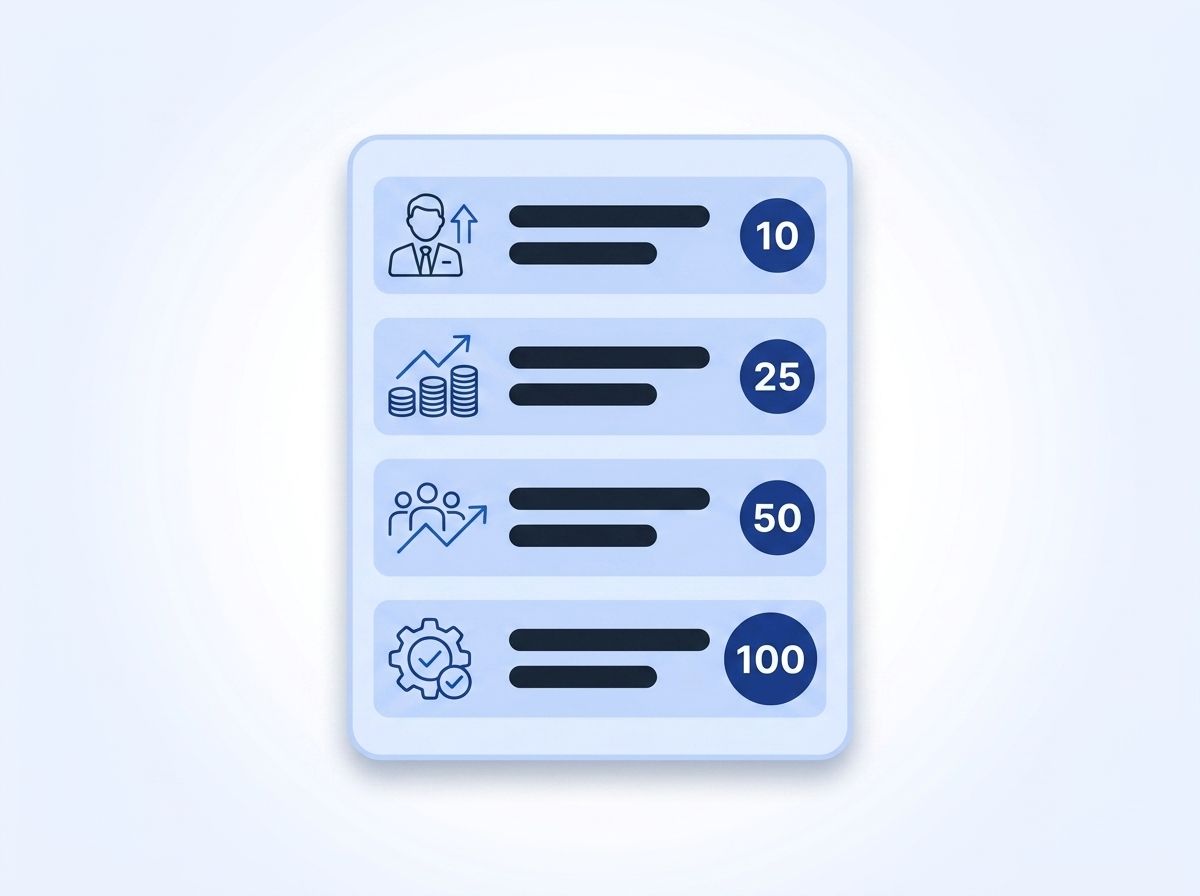
By the end of this step, every signal type has a point value instead of being treated as equally important. Not all signals predict a purchase equally well: an analysis of 1 million B2B software purchases found lift ranging from 25% for a recent funding round up to 46% for enterprise AI tool adoption, with VP hires (28%) and 20%+ headcount growth (38%) landing in between (Bloomberry, 2025). Those figures are the starting point for the point values you assign below.
Broken down by average purchase counts, companies adopting an enterprise AI tool made 46% more subsequent software purchases than companies that didn't (4.2 vs. 2.87 average), companies with 20%+ headcount growth bought 38% more (3.01 vs. 2.18), a new VP hire correlated with 28% more purchases (3.12 vs. 2.44), and a recent funding round correlated with 25% more (2.5 vs. 2.0) (Bloomberry, 2025, updated January 2026).
Use figures like these as a starting point, not gospel — recency, source reliability, and your own closed-won history should adjust the exact weights. A funding round from six months ago shouldn't score the same as one from six days ago. Datamagnet's ICP Company Search lets you re-check headcount and firmographic filters against a live account list so a stale "high growth" tag doesn't inflate a score it no longer deserves.
Verification: each signal type now has a documented point value and a note on how fast that value decays with age.
Step 3: How Do You Build a Composite Score for Overlapping Signals?
By the end of this step, an account with three signals firing at once outranks an account with one, automatically, not by gut feel. A composite score sums the weighted value of every active signal on an account, then adds a co-occurrence bonus when two or more fire within a defined window, 30 days is a reasonable starting point. A funding round and a VP hire in the same month signals a company actively reorganizing its budget and buying committee at once, which is worth more than either signal alone.
<!-- [UNIQUE INSIGHT] -->Isn't it strange that most scoring models still treat signals as separate alerts instead of one combined picture? An account with a funding round and a VP hire in the same month isn't just "funding + hiring." It's a company actively reorganizing its buying committee and its budget at the same time.
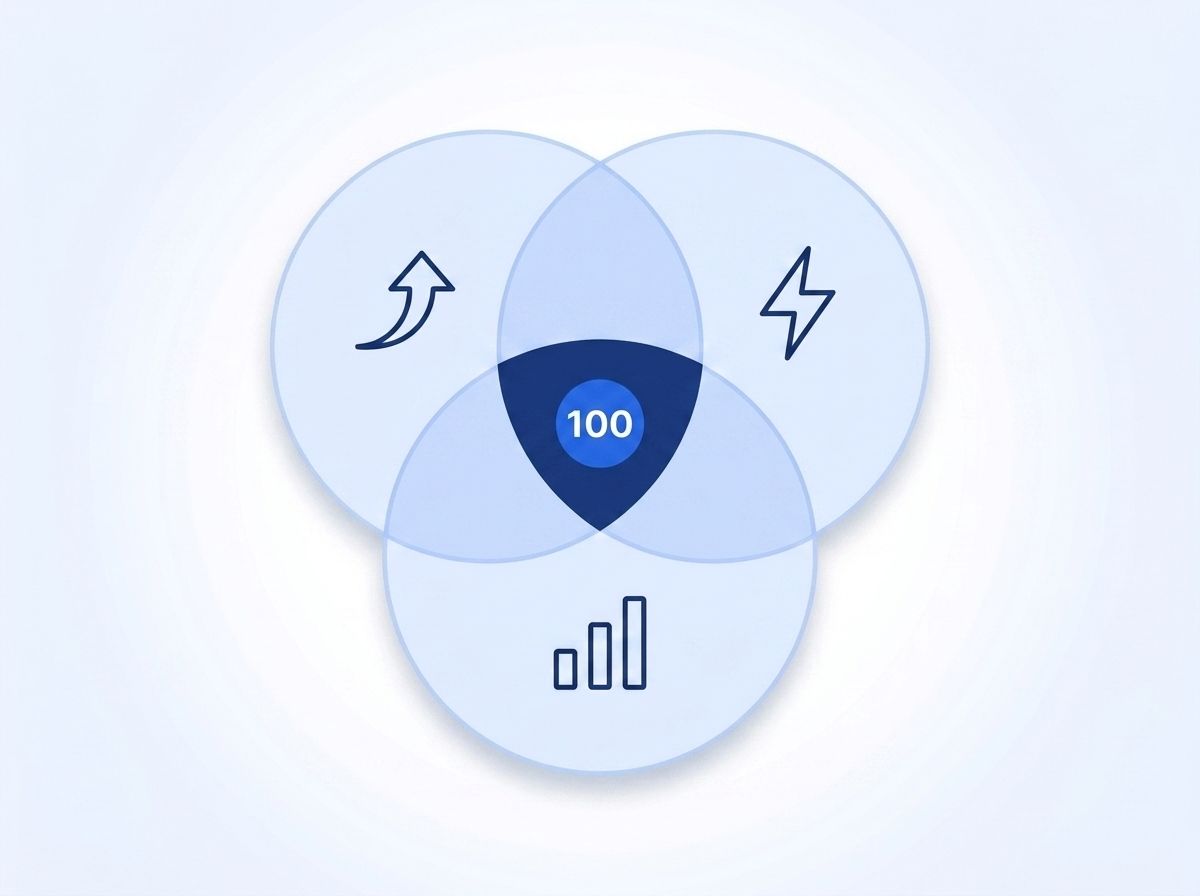
Build the formula in whatever system already touches your CRM data — a spreadsheet works for a pilot, a data warehouse view works at scale. The math doesn't need to be complicated: signal score + signal score + co-occurrence bonus = composite score, then bucket accounts into tiers (say, Tier 1 for 80+, Tier 2 for 50-79, Tier 3 below that).
Verification: pull ten accounts with known outcomes and confirm the ones that actually closed land in your top tier.
Step 4: What Response-Time SLA Should You Set for Each Score Tier?
By the end of this step, your top-tier accounts get contacted within hours, not whenever a rep gets to them. A high composite score means nothing if it sits in a queue for three days: contacting a lead within 5 minutes instead of 30 makes a rep roughly 100 times more likely to make contact and 21 times more likely to qualify it (Oldroyd, MIT Sloan / HBR, 2011). That decay curve applies to a hot intent signal just as brutally as it does to an inbound form fill.
Set explicit SLAs by tier: Tier 1 accounts get a same-day touch, Tier 2 within 48 hours, Tier 3 into a nurture cadence. This is also where AI-assisted prioritization earns its keep — in 2026, sales organizations that give reps AI-enabled "next best action" recommendations were 2.6 times more likely to hit commercial growth targets than those that didn't (Gartner, 2026 survey of 227 chief sales officers). A next-best-action layer only works, though, if the underlying score it's acting on is trustworthy.
Citation capsule: Speed converts faster than volume. A rep who responds to a hot composite signal within five minutes is roughly 100 times more likely to reach the prospect than one who waits thirty, and that five-minute window matters more than any single data point in the score itself.
Verification: check your CRM's average first-touch time against each tier's SLA — if Tier 1 accounts are waiting more than a few hours, the SLA isn't real yet.
Step 5: How Do You Automate Correlation and Routing With Signals and Webhooks?
By the end of this step, scoring and routing happen without a rep or ops person manually cross-referencing spreadsheets. Manual correlation, someone checking five tools to see if the same company shows up twice, doesn't survive past a few dozen accounts a week. Register signal monitors for each account on your target list, combining job-change tracking, company engagement, and person engagement on the same account list, so overlapping events land against one company record instead of three disconnected alerts.
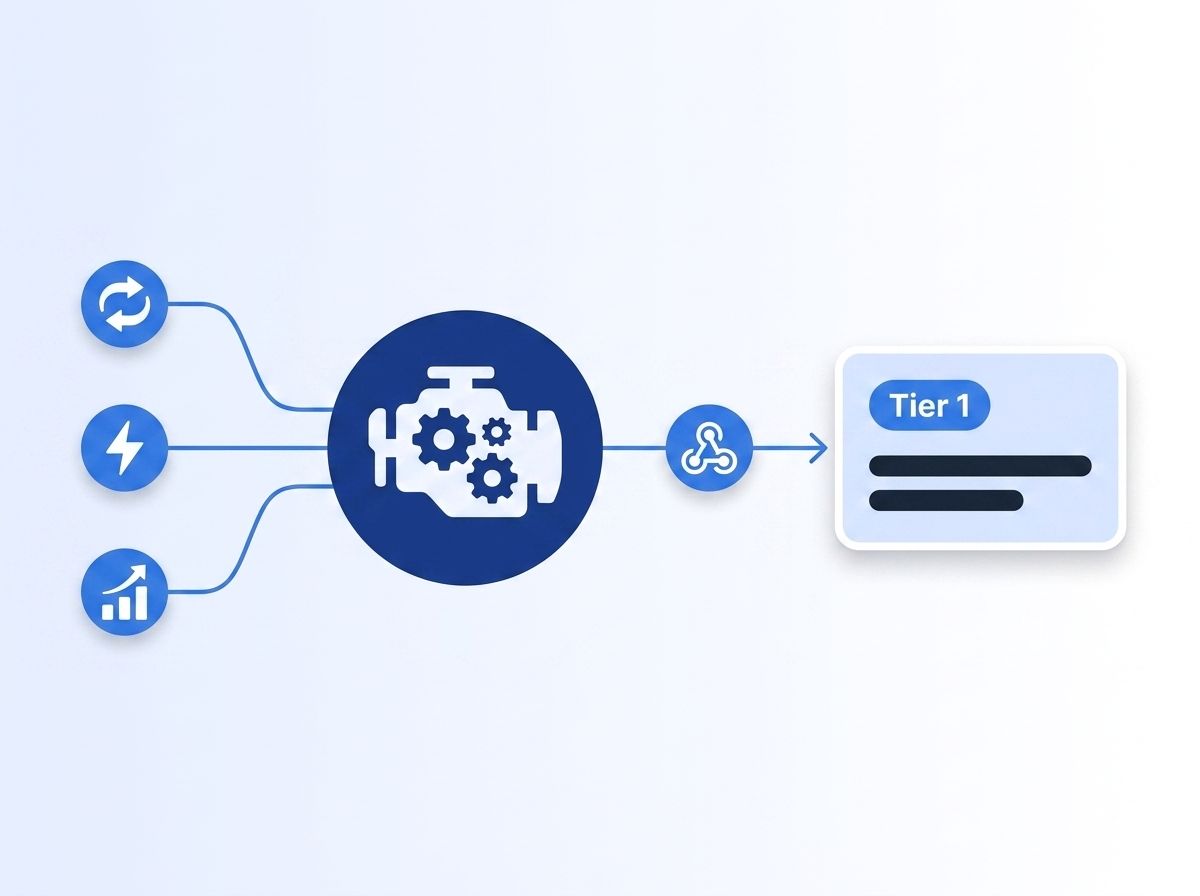
Deliver every event through webhooks so your scoring logic runs the moment a signal fires, not on a batch schedule. Teams that combine job-change tracking with engagement monitoring often start with Datamagnet's champion tracking cookbook, which shows how to re-engage a contact automatically the moment they move to a new company — the same pattern extends cleanly to full-account signal stacking.
Verification: trigger a test event and confirm it updates the composite score and hits your CRM within minutes, not the next scheduled sync.
Step 6: How Often Should You Review and Recalibrate Signal Weights?
By the end of this step, your scoring model reflects what's actually closing, not what you assumed six months ago. A static rubric goes stale the same way a static contact list does: pull last quarter's closed-won and closed-lost accounts, check where they landed in your tiers, and adjust signal weights wherever the model missed. Quarterly is the minimum cadence worth committing to, since signal reliability shifts as your ICP and market change underneath it.
When did you last check whether your weights still match reality?
<!-- [UNIQUE INSIGHT] -->This is also the moment to build in capacity math, which most scoring frameworks skip entirely: the median SDR runs about 112 prospecting activities a day, and monthly initial-conversation volume per rep is down 40% industry-wide since 2018 (The Bridge Group, 2025 SDR Models, Motions & Metrics Report, 2025). If your Tier 1 list keeps growing faster than rep capacity, the fix isn't more signals — it's tighter weights.
Verification: confirm the accounts your model would have flagged as Tier 1 last quarter actually match your real closed-won list at a meaningfully higher rate than Tier 3.
What Mistakes Should You Avoid When Scoring Accounts?
1. Treating every signal as equally predictive. A funding round and a single LinkedIn like aren't the same strength of signal, but plenty of scoring models give them equal weight by default. Fix it by grounding weights in your own closed-won data, not a vendor's default rubric.
2. Skipping the response-time SLA. A perfect score with a three-day response time still loses to a mediocre score contacted in five minutes. Pair every tier with an explicit, enforced SLA.
3. Scoring signals at the wrong level. Job changes happen to people; funding and headcount growth happen to companies. Mixing granularity without resolving both to the same account record produces duplicate or fragmented scores.
4. Never recalibrating. In 2026, most organizations still call their intent data unreliable (DemandScience, 2026) — and a model that's never checked against real outcomes stays unreliable indefinitely.
5. Sending every flagged account to every rep. With rep capacity already stretched thin (The Bridge Group, 2025), routing forty undifferentiated alerts a day guarantees most get ignored. Tiering exists specifically to prevent this.
What Does Success Look Like?
What does a working framework actually feel like day to day? Your reps see fewer accounts in their queue, not more — and the ones that remain convert at a noticeably higher rate. Teams that prioritize with intent data see conversion to closed opportunity at 21.3%, compared with 8.4% for accounts worked without prioritization (Forrester via The Starr Conspiracy, 2025) — roughly two and a half times the rate.
Watch for a shrinking gap between when a signal fires and when a rep responds, a Tier 1 list that stays small enough to actually work in a day, and closed-won accounts clustering in your top tier quarter over quarter. Once that pattern holds, the next stretch goal is connecting your composite score directly to automated routing, so a Tier 1 account reaches a rep's queue before they've even opened their inbox.
Frequently Asked Questions
What counts as an "overlapping" intent signal?
An overlapping signal is any second (or third) buying trigger that fires on the same account within a defined window, typically 30 days. A job change plus a funding round on the same company, or a hiring surge plus repeated LinkedIn engagement, both qualify. The overlap itself — not just the individual signals — is what a composite score is designed to capture.
How many signals should trigger top-priority status?
There's no universal number, but two or more independently weighted signals firing within 30 days is a reasonable starting threshold for most B2B teams. Tune it against your own closed-won data — accounts that hit Tier 1 by this rule should convert at a meaningfully higher rate than single-signal accounts, similar to the 21.3% vs. 8.4% gap Forrester found between prioritized and non-prioritized accounts.
Can I automate account prioritization without a data science team?
Yes. A weighted composite score is arithmetic, not machine learning — a spreadsheet or a CRM formula field can run it. The automation piece that actually matters is delivery: routing signal events through webhooks so the score updates the moment a signal fires, instead of on a manual refresh.
What's the biggest mistake teams make when scoring accounts?
Treating every signal source as equally predictive. Independent analysis of 1 million B2B purchases found the lift from different signal types varies from 25% to 46% (Bloomberry, 2025) — a flat weighting scheme throws that variance away and treats a weak signal like a strong one.
How often should I recalibrate signal weights?
Quarterly, at minimum. Pull closed-won and closed-lost accounts, check where they landed in your tiers, and adjust weights where the model was wrong. Signal reliability also shifts as your ICP and market change, so a rubric built a year ago is unlikely to still reflect what's actually converting today.
Ready to Stack Your Signals?
Chasing forty flagged accounts a day isn't a strategy — it's noise with a dashboard attached. Map your signal sources, weight them by real predictive strength, stack the overlaps into one composite score, and back it with a response SLA your team can actually hit. See how Datamagnet's Signal API tracks job changes, engagement, and company growth on the same account — and start scoring your own pipeline this week.
For more on tracking individual buying triggers, see real-time job-change intent signal APIs, and for the account-research workflow this framework feeds into, see account research infrastructure for AEs.
Sources
- DemandScience, 2026 State of Performance Marketing Report (via MarTech, "The intent data playbook is breaking down"), retrieved 2026-08-06, https://martech.org/the-intent-data-playbook-is-breaking-down/
- Forrester 2024 B2B Buying Study (via The Starr Conspiracy, "B2B Intent Data Benchmarks 2025"), retrieved 2026-08-06, https://www.thestarrconspiracy.com/insights/benchmarks/b2b-intent-data-benchmarks-2025
- Bloomberry, "Which GTM Signals Actually Indicate Intent? (Data from 1M Purchases)", retrieved 2026-08-06, https://bloomberry.com/blog/i-analyzed-1m-software-purchases-to-find-the-strongest-buyer-intent-signals/
- Oldroyd, MIT Sloan School of Management / Harvard Business Review, "The Short Life of Online Sales Leads", retrieved 2026-08-06, https://hbr.org/2011/03/the-short-life-of-online-sales-leads
- Gartner, "Gartner Survey Finds Sales Organizations That Provide AI-Enabled Next Best Actions Are 2.6x More Likely to Achieve Commercial Growth", retrieved 2026-08-06, https://www.gartner.com/en/newsroom/press-releases/2026-05-20-gartner-survey-finds-sales-organizations-that-provide-ai-enabled-next-best-actions-are-two-point-six-times-more-likely-to-achieve-commercial-growth
- The Bridge Group, "2025 SDR Models, Motions & Metrics Report", retrieved 2026-08-06, https://www.bridgegroupinc.com/research/2025-sdr-models-metrics-report-the-bridge-group
- Forrester, "The Forrester Wave: Intent Data Providers For B2B, Q1 2025", retrieved 2026-08-06, https://www.forrester.com/report/the-forrester-wave-tm-intent-data-providers-for-b2b-q1-2025/RES182002
- Datamagnet, Signal API documentation, retrieved 2026-08-06, https://docs.datamagnet.co/api-reference/endpoints/signal-create
