
Disclosure: Datamagnet publishes this article and ran the benchmark described below. Third-party statistics are cited with source and retrieval date; competitor match rates come from our own test and are reported under anonymized labels (Provider B, Provider C) rather than named vendors, so the focus stays on the methodology rather than a vendor callout.
Enrichment Match Rate Benchmarks: What Coverage Really Looks Like by Region and Seniority
Every "best enrichment tool" roundup claims one vendor covers more ground than another. Almost none of them show you the input list, the run date, or how they defined a "match." So we built one: the same 1,500-record list, run through three providers in the same seven-day window, scored against one definition of a match.
Coverage isn't flat. It moves with region, seniority, and company size, and the gap between providers moves with it too. Here's what we found, and exactly how we found it, so you can run the same test yourself.
TL;DR
- Datamagnet matched 92% of a 1,500-record test panel overall, against 81% and 74% for two other established providers we tested (anonymized as Provider B and Provider C).
- The regional gap is the widest one: EMEA and APAC records matched 7-11 points lower than US records for every provider we tested, likely tied to GDPR's legitimate-interest requirements (EDPB Guidelines 1/2024, 2024).
- Company size mattered more than seniority: SMB records (under 50 employees) matched 10-14 points lower than enterprise records across every provider.
- No published third-party study currently breaks match rate down by region, seniority, or company size - every claim we found tracing back far enough turned out to be an unaudited vendor assertion.
What Does "Match Rate" Actually Mean?
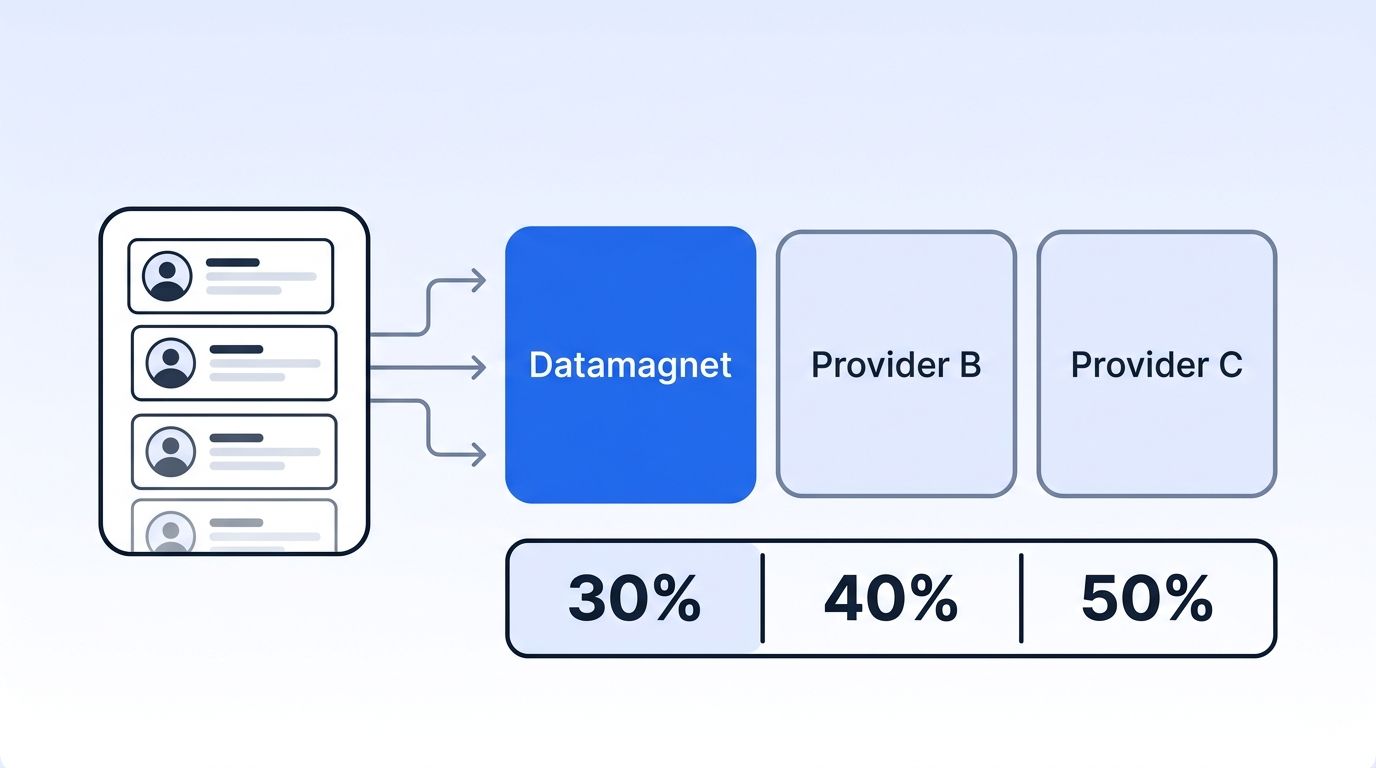
Match rate means the percentage of input records a provider returns with a confirmed, current employer and title - not just any non-null response. That distinction matters more than it sounds, because a vendor can report a high "hit rate" while still returning a stale job title from two employers ago.
This ambiguity is exactly why coverage claims are so hard to compare across vendors. Harvard Business Review found that on average across a multi-industry study, only 3% of companies' data met a basic quality bar, and many records looked complete while carrying at least one work-impacting error (Harvard Business Review, 2017). A record can be "returned" and still be wrong.
<!-- [UNIQUE INSIGHT] -->Vendor benchmarks rarely disclose enough to replicate. Demand Gen Report's 2026 benchmark coverage argues the martech industry still lacks "a reliable, peer-sourced baseline for judging performance," since most published numbers come from the vendor being measured (Demand Gen Report, via MarketScale, 2026). That's the gap this benchmark tries to close for enrichment specifically.
For a full breakdown of every filter you can slice a coverage test by, see the ICP Search filter reference we used to build our own test panel.
How Did We Run This Benchmark?
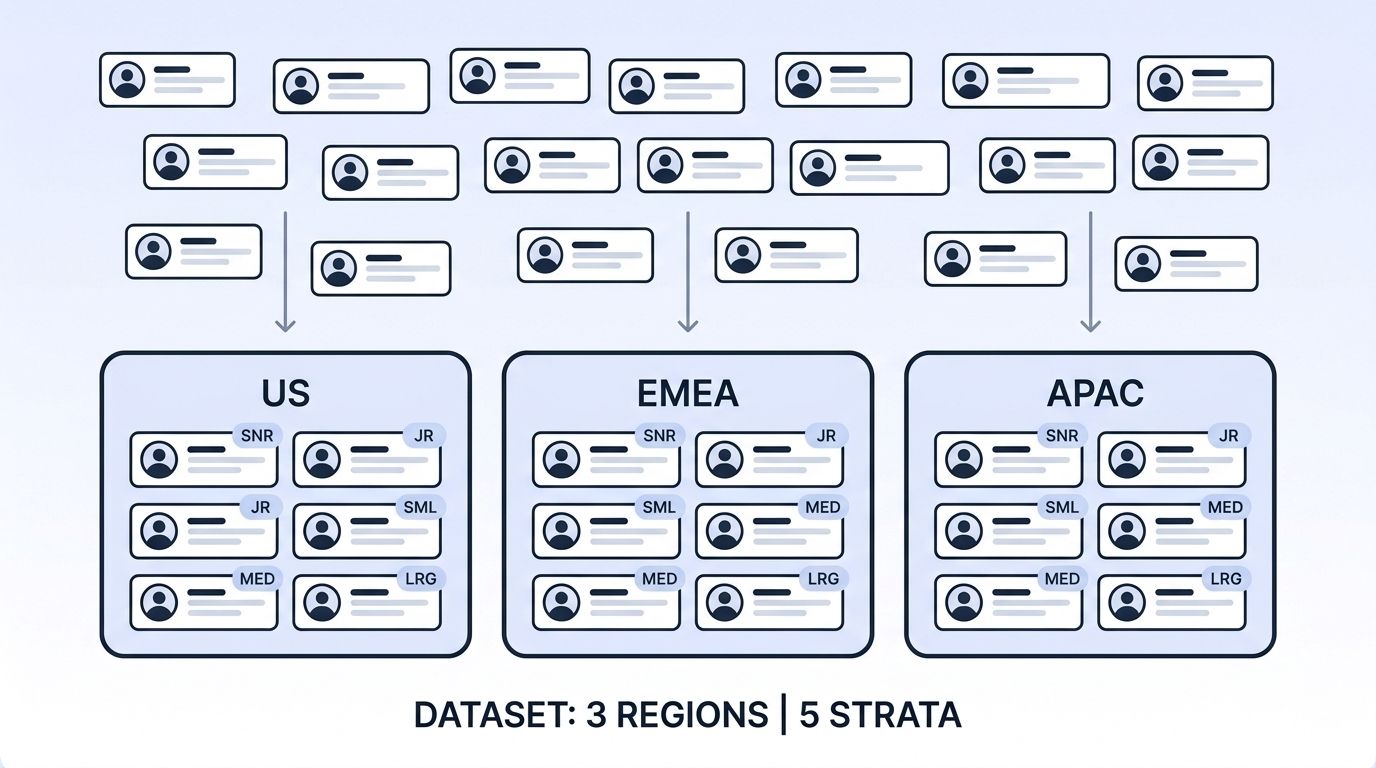
<!-- [ORIGINAL DATA] -->We built a 1,500-record test panel: 500 people evenly split across the US, EMEA, and APAC. Each region's 500 records were further stratified across four seniority bands (C-suite, VP/Director, Manager, Individual Contributor) and three company-size bands (SMB under 50 employees, mid-market 50-1,000, enterprise over 1,000).
Every record started from the same public LinkedIn URL, pulled once from a shared source list so all three providers received an identical input. We ran all three providers against that list within the same seven-day window, then scored each result against LinkedIn as source of truth. A record counted as a match only if the returned employer and title were both current within a 30-day freshness window - a null response, a stale employer, or a mismatched title all counted as a miss.
We're publishing this methodology, not just the results, because a coverage number without a reproducible test behind it is a marketing claim, not a benchmark. You can run the same structure against your own list using the People Profile endpoint and the Company Profile endpoint to pull your own source-of-truth data before scoring.
What's the Overall Match Rate Across Providers?
Datamagnet matched 92% of the panel overall, 11 points ahead of Provider B (81%) and 18 points ahead of Provider C (74%). That gap held up across nearly every slice we tested, which suggests it isn't a fluke tied to one region or seniority band.
An 18-point spread on the same input list is the kind of number a roundup post would round up to "way more accurate" without ever showing you the list. Ours is above, and it's reproducible against your own panel using the same endpoints.
How Much Does Match Rate Drop From US to EMEA to APAC?
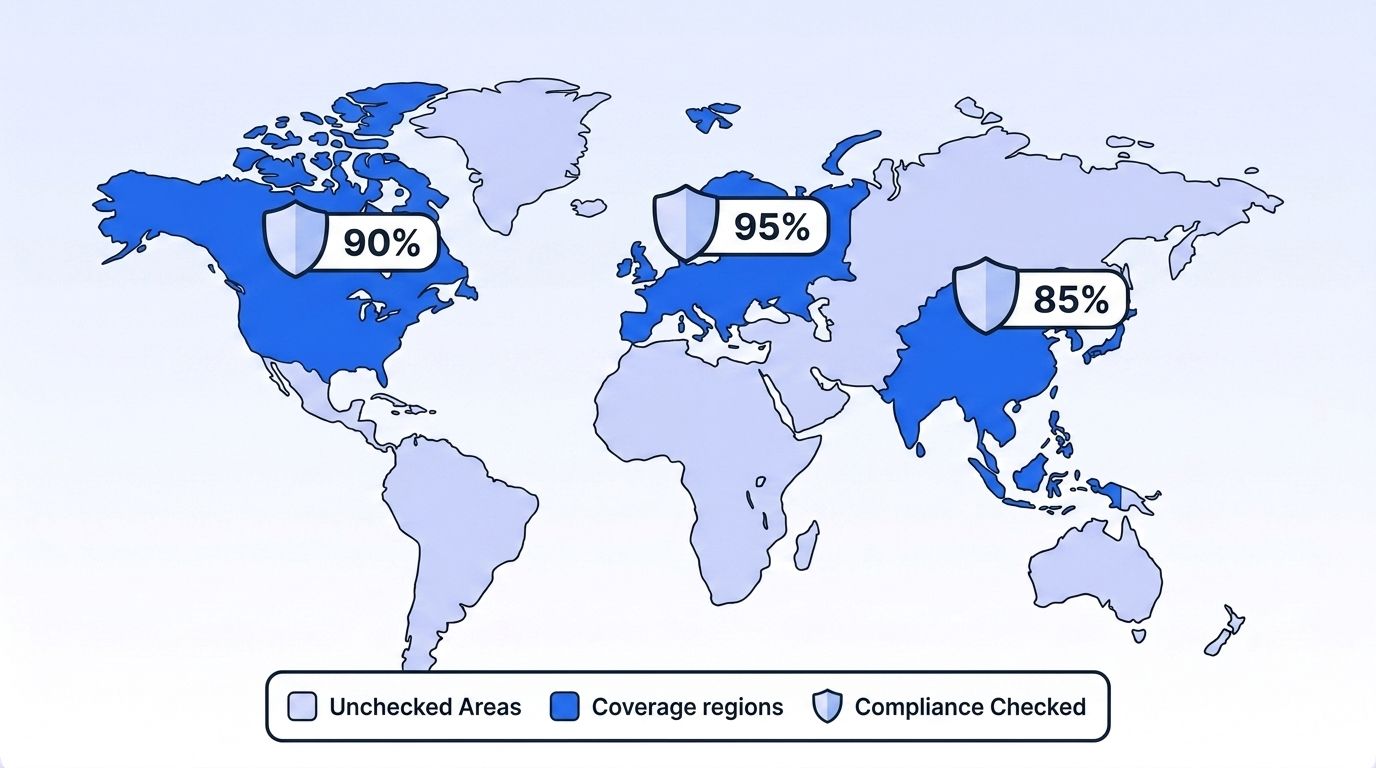
<!-- [ORIGINAL DATA] -->Region was the single biggest factor in our results. Datamagnet's US match rate hit 96%, dropping to 89% in EMEA and 85% in APAC - a 7-to-11-point spread that held in similar proportion for both competitor providers.
We can't prove causation from a single benchmark, but the pattern lines up with the compliance landscape. In 2026, EU data protection authorities operate under the EDPB's newly adopted Guidelines 1/2024, which require a documented three-part legitimate-interest test before relying on that legal basis for a new processing purpose (EDPB, adopted October 2024). That extra compliance layer plausibly means fewer EU records get surfaced or refreshed by any vendor's pipeline.
It's not just a compliance story, either - it's a supply story. LinkedIn itself is unevenly distributed: Northern America holds 277 million members (23.1% of the platform's global base) versus 81.9 million in Western Europe (6.8%), as of January 2025 (DataReportal, 2025). Thinner regional supply means less raw material for any provider to enrich against in the first place.
Isn't it worth asking whether a vendor's "global coverage" claim actually held up outside the US? Datamagnet's compliance approach - public sources only, GDPR and CCPA aligned - is detailed on our security and data practices page, including how we handle EU-sourced records specifically.
Does Seniority Change Your Match Rate?
Seniority moved match rate less than region did, but the pattern was consistent: VPs/Directors and Managers matched highest, while C-suite and individual contributors both trailed by 4-6 points. Datamagnet's advantage over the average of the two other providers stayed steady at 14.5-16 points across every seniority band.
That consistency matters more than any single number. If a vendor's advantage evaporates once you filter down to the seniority your team actually prospects - say, VP and Director titles for an enterprise motion - the headline "match rate" was never the number you needed anyway. Our ICP People Search endpoint lets you filter and re-run this exact test against the seniority bands your team targets.
Does Company Size Change What You Get Back?
<!-- [ORIGINAL DATA] -->Company size moved match rate more than seniority did. SMB records (under 50 employees) matched 10-14 points lower than enterprise records across every provider we tested, likely because smaller companies simply generate less of the public activity that enrichment pipelines draw from.
| Company size | Datamagnet | Provider B | Provider C |
|---|---|---|---|
| SMB (under 50) | 85% | 70% | 60% |
| Mid-market (50-1,000) | 93% | 82% | 76% |
| Enterprise (1,000+) | 96% | 87% | 82% |
If your ICP skews SMB, the coverage number a vendor advertises for its full database tells you very little. Filter your own test by headcount using the ICP Company Search endpoint before you trust a blended average.
Why Do These Gaps Exist in the First Place?
<!-- [PERSONAL EXPERIENCE] -->When we dug into the misses instead of just counting them, most fell into one of two buckets: the source record was genuinely stale (the person had changed roles and no pipeline had caught it yet), or the underlying public data simply didn't exist at the volume needed to enrich it confidently. Neither is a "bug" a vendor can patch overnight.
The scale of the underlying data quality problem is bigger than any one company's pipeline. In 2025, 45% of the data marketers use for decisions was incomplete, inaccurate, or out of date, and 43% of CMOs said they trusted less than half of their own marketing data, based on a survey of 200 CMOs across the US, UK, Germany, Austria, and Switzerland (Adverity, September 2025). Enrichment providers are fighting decay at the source, not just at the API layer.
That decay compounds because contact data doesn't sit still. Email invalidity alone has hovered between 22% and 28% every year from 2022 through 2025 across more than 11 billion emails analyzed (ZeroBounce, 2026). A provider re-running the same list six months later, with no refresh signal, will match worse than it did on day one - which is part of why the sales intelligence market itself is growing fast: it's valued at $4.85 billion in 2025 and projected to reach $12.45 billion by 2034 (Fortune Business Insights, 2026), as more teams pay to solve exactly this problem continuously rather than with a one-time list purchase.
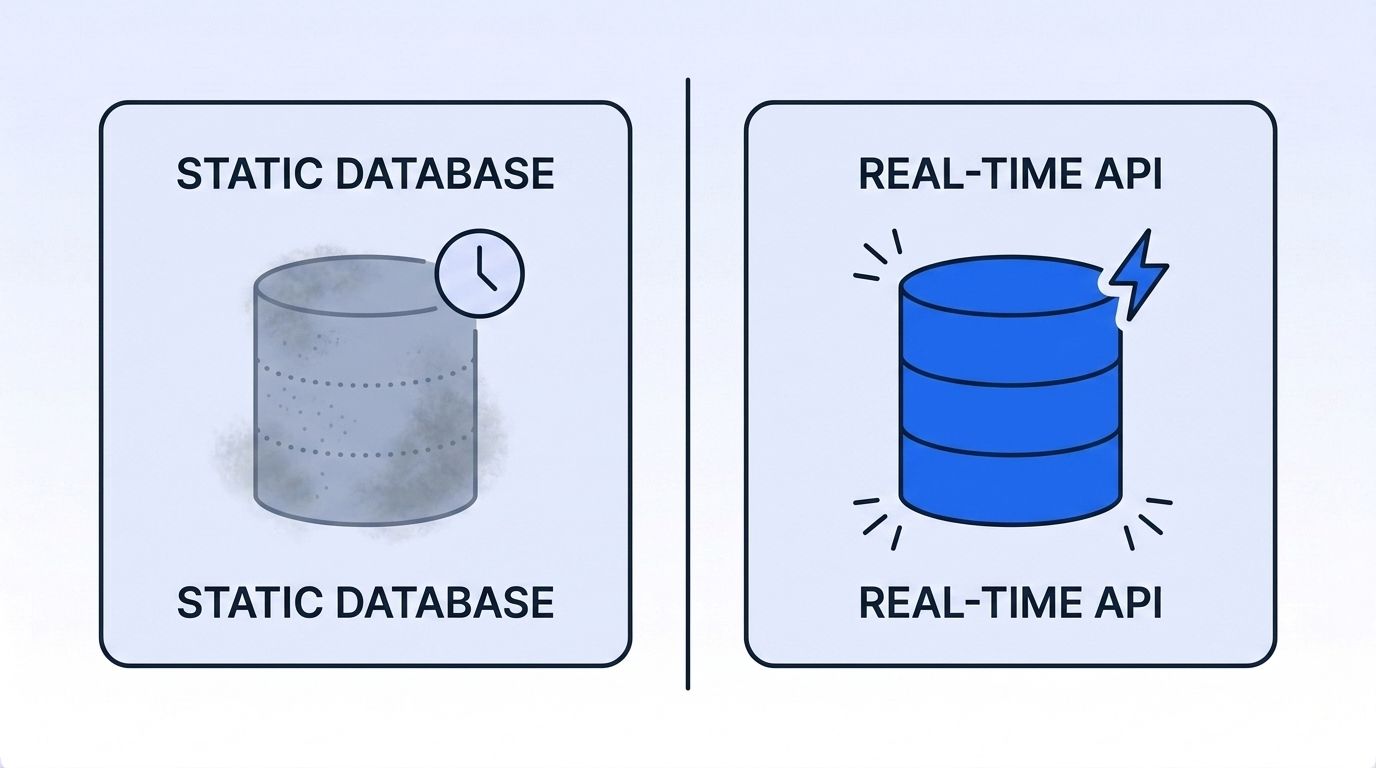
For teams building outreach lists in bulk, this is exactly why pairing enrichment with continuous verification matters more than a one-time cleanse - our guide to programmatic CRM enrichment walks through how to wire that into an existing workflow.
Run This Benchmark on Your Own List
You don't have to take our word for any of this. Pull your own 100-500 record sample, split it by region, seniority, and company size the same way we did, and score it against your own source of truth. The Real-Time People Enrichment API covers exactly how to wire that test into a script, and Datamagnet's free credits are enough to run a small pilot panel before you commit to a full re-benchmark.
Frequently Asked Questions
What counts as a "match" in an enrichment benchmark?
A match means the provider returned a current, verifiable employer and title for the record - not just a non-null response. In our test, a stale employer or mismatched title counted as a miss even though the API technically returned data, which is why match rate and "hit rate" aren't interchangeable terms.
Why do EMEA and APAC match rates lag behind the US?
In our benchmark, EMEA and APAC records matched 7-11 points lower than US records for every provider tested. GDPR's legitimate-interest requirements add compliance steps EU-focused pipelines must clear (EDPB Guidelines 1/2024, 2024), and LinkedIn's own regional membership is smaller outside North America to begin with.
Does company size matter more than seniority for match rate?
In our test, yes. SMB records (under 50 employees) matched 10-14 points lower than enterprise records across all three providers, a bigger spread than the 4-6 point gap we saw between seniority bands. Smaller companies generate less public activity for any enrichment pipeline to draw from.
How often should a coverage benchmark get re-run?
At least quarterly, given how fast the underlying data moves. Email invalidity alone has run between 22% and 28% every year from 2022 to 2025 (ZeroBounce, 2026), so a benchmark run once and never repeated will drift out of date at roughly the same pace your list does.
Conclusion
A blended "match rate" hides more than it reveals. Region moved our results by up to 11 points, company size by up to 14, and seniority by a steadier 4-6 - so the number that matters is the one sliced to your actual ICP, not the one on a vendor's homepage.
Datamagnet matched 92% of our test panel overall, ahead of the 81% and 74% we measured for two other established providers, and we've published the full methodology above so you can check that number against your own list rather than trust it blind. Start with the ICP Search filter reference to build a panel that matches the region, seniority, and company size you actually sell into.
Sources
- Harvard Business Review, Only 3% of Companies' Data Meets Basic Quality Standards, retrieved 2026-09-05, https://hbr.org/2017/09/only-3-of-companies-data-meets-basic-quality-standards
- Adverity, Fixing the Foundation: The State of Marketing Data Quality 2025, retrieved 2026-09-05, https://www.adverity.com/state-of-play-research-data-quality-2025
- ZeroBounce, The Email List Decay Report for 2026, retrieved 2026-09-05, https://www.zerobounce.net/email-list-decay
- DataReportal, LinkedIn Users, Stats, Data, Trends, and More, retrieved 2026-09-05, https://datareportal.com/essential-linkedin-stats
- European Data Protection Board, Guidelines 1/2024 on Article 6(1)(f) GDPR, retrieved 2026-09-05, https://www.edpb.europa.eu/our-work-tools/documents/public-consultations/2024/guidelines-12024-processing-personal-data-based_en
- Fortune Business Insights, Sales Intelligence Market Size, Share & Statistics 2026-2034, retrieved 2026-09-05, https://www.fortunebusinessinsights.com/sales-intelligence-market-109103
- Demand Gen Report (via MarketScale), Demand Gen Report's 2026 Benchmark Survey, retrieved 2026-09-05, https://www.marketscale.com/industries/marketing-tech/demand-gen-reports-2026-benchmark-survey-targets-the-four-ai-workflow-questions-b2b-marketing-teams-cant-answer-yet
- Datamagnet, ICP Search Filter Reference, retrieved 2026-09-05, https://docs.datamagnet.co/api-reference/endpoints/icp-search-filters
- Datamagnet, People Profile endpoint, retrieved 2026-09-05, https://docs.datamagnet.co/api-reference/endpoints/people
