
Disclosure: This article is published by Datamagnet. Vendor claims are self-reported unless otherwise noted.
How to Benchmark Your Sales Tech Stack Against Peers in 2026
Is your sales tech stack bloated, thin, or about right? Most RevOps leaders can't answer that with a straight number, because "benchmark" usually means a gut check against whatever the last vendor demo implied. A real benchmark means comparing your tool count, your utilization rate, and your spend against verified industry data — not against a sales deck.
TL;DR
- The average enterprise runs roughly 106 SaaS applications, down from a 2022 peak of 130, but still uses only 47% of its licensed seats (Zylo, 2025).
- 70% of sellers say they feel overwhelmed by the volume of technology required to do their jobs (Gartner).
- 21% of purchased apps sit as complete shelfware, and another 51% run below half their licensed capacity (Vertice, 2025).
- Benchmark tool count, utilization, and consolidation readiness together — spend alone hides which tools are actually doing work.
What Does It Actually Mean to Benchmark a Sales Tech Stack?
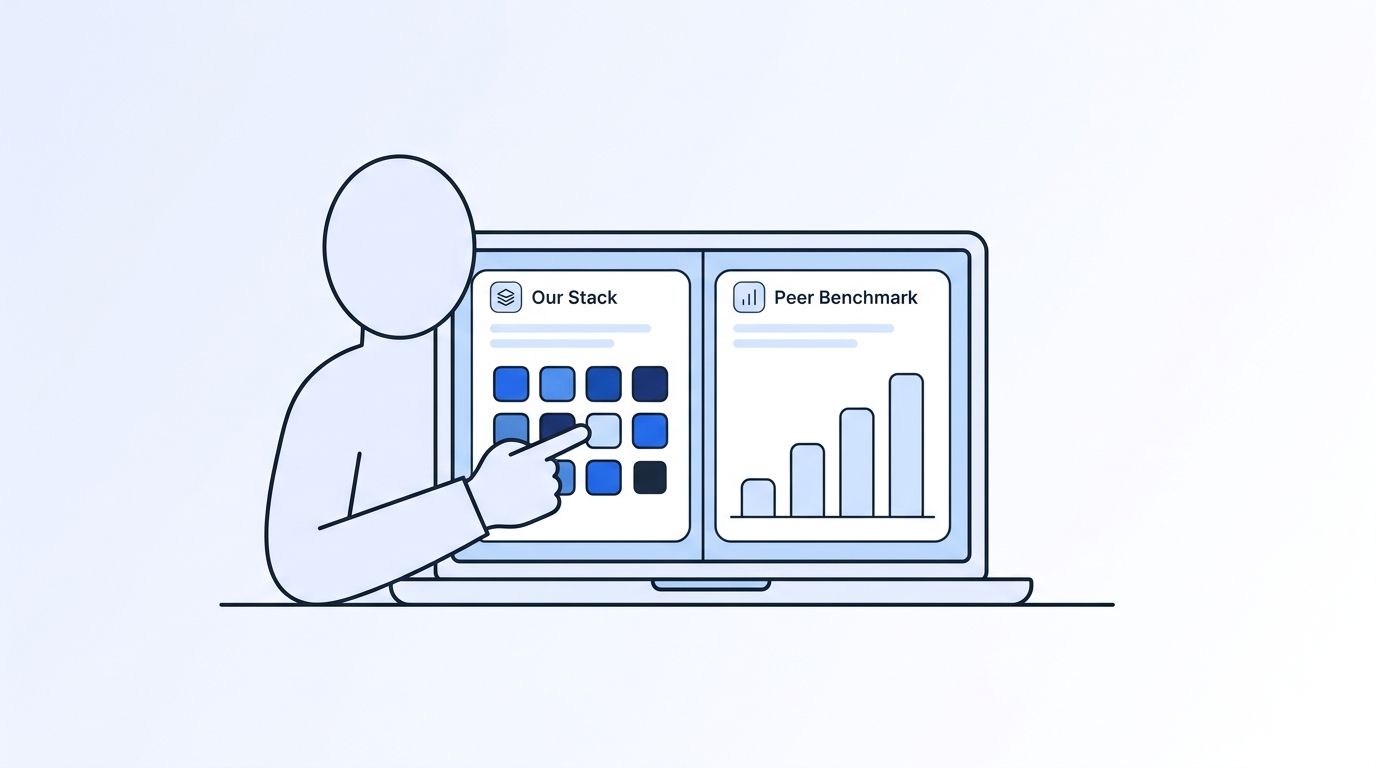
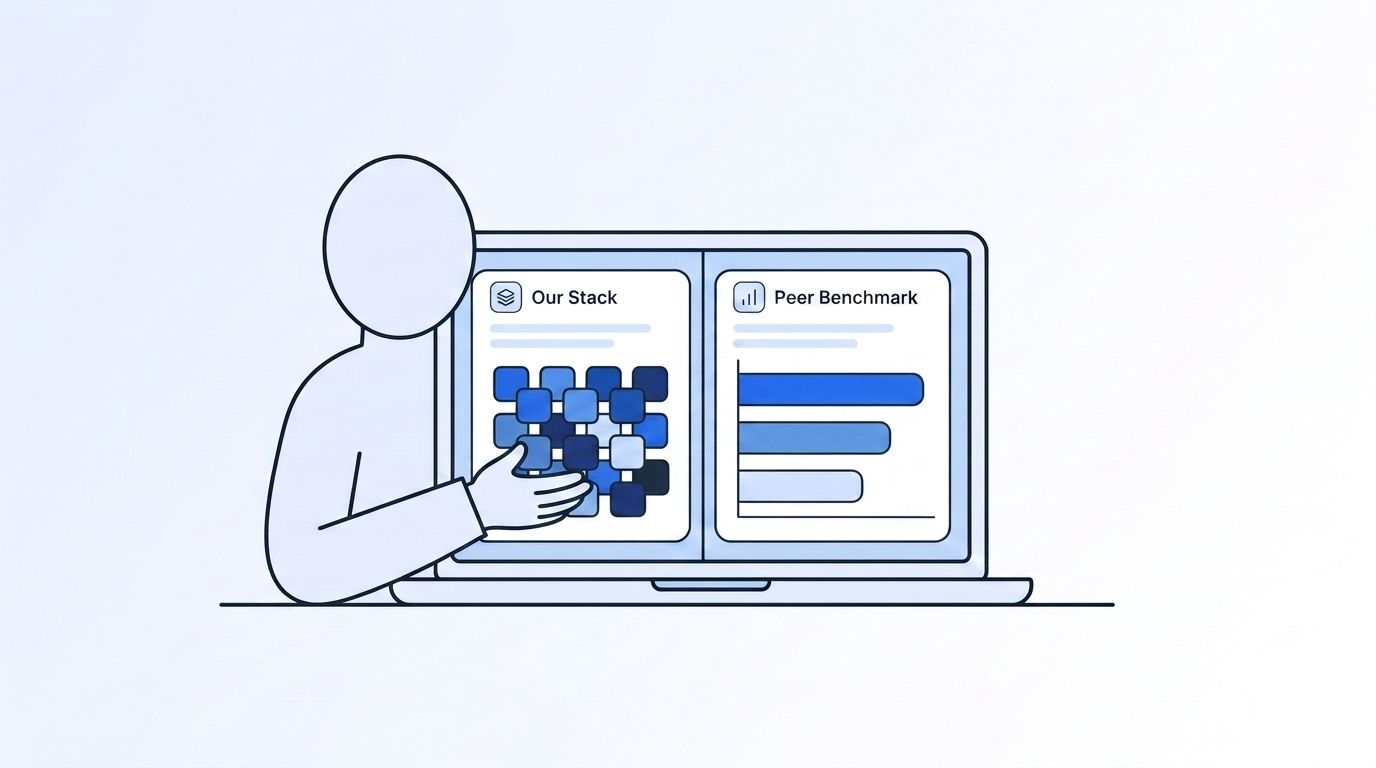
Benchmarking your sales tech stack means comparing three numbers against verified peer data: how many tools you run, how much of each tool your team actually uses, and what you spend per rep. Most teams only track the third number, which is why "cut costs" conversations rarely fix the real problem.
A spend-only view tells you a tool costs $400 per rep per year. It doesn't tell you whether reps touch that tool daily or ignored it after onboarding. You need utilization data alongside cost data, or you're optimizing the wrong variable.
That distinction matters more now than it did a few years ago. As of 2025, the average enterprise runs about 106 SaaS applications, down from a peak of 130 in 2022 (Zylo, 2025 SaaS Management Index). Stacks are shrinking in count. Whether they're shrinking in waste is a separate question — and the data below suggests they aren't, yet.
real-time LinkedIn company data
How Many Tools Should Your Sales Team Actually Run?
There's no single "right" tool count, but the direction matters more than the destination: enterprises are actively consolidating, and sellers are telling researchers the current volume is too much. In 2025, 70% of sellers reported feeling overwhelmed by the amount of technology required just to do their jobs (Gartner). That's not a productivity story. It's a distraction story.
Fewer tools doesn't automatically mean better outcomes, though. It only helps if the tools you keep are the ones people actually open. Counting logos in your stack tells you almost nothing on its own — you need to pair the count with an honest utilization check, which is where most benchmarking efforts stall out.
Practical benchmark: track your tool count quarterly alongside two questions for each tool — who used it in the last 30 days, and would losing it change a rep's daily workflow? If the answer to both is "barely anyone" and "no," that tool is a consolidation candidate, regardless of what it costs.
filtering target accounts by industry, headcount, and tech stack
What's a Healthy Utilization Rate for Your Sales Tools?
A healthy sales tech stack uses at least half of every license it pays for — and most stacks don't clear that bar. Enterprises use only 47% of their licensed SaaS seats on average, leaving 53% unused (Zylo, 2025 SaaS Management Index). That's the aggregate number across all software, not sales tools specifically, but it's the closest verified benchmark available, and sales stacks — with their heavy mix of point solutions — are unlikely to be the exception.
The breakdown gets worse when you separate "unused" from "underused." Vertice's 2025 SaaS Wastage Report found that 21% of purchased applications are complete shelfware, sitting idle with no meaningful usage at all. Another 51% are underutilized, meaning teams are using less than half the licenses they bought (Vertice, 2025 SaaS Wastage Report). Add those together and roughly three-quarters of a typical software portfolio is running well below what was paid for.
What this means for your benchmark: if fewer than half your sales tools clear 50% seat utilization, you're tracking close to the industry norm — not an outlier, just not efficient either. Utilization data is the single most useful number for deciding what to renew.
keeping CRM records fresh as contacts change roles
Why Does CRM Data Quality Belong in a Tech Stack Benchmark?
<!-- [UNIQUE INSIGHT] -->A tech stack benchmark that only counts tools and ignores data freshness misses half the picture. You can run a lean, well-utilized stack and still lose deals because the CRM data feeding it is stale. Contact records decay for one unavoidable reason: people change jobs, titles, and companies constantly, and most CRMs have no mechanism to catch it automatically.
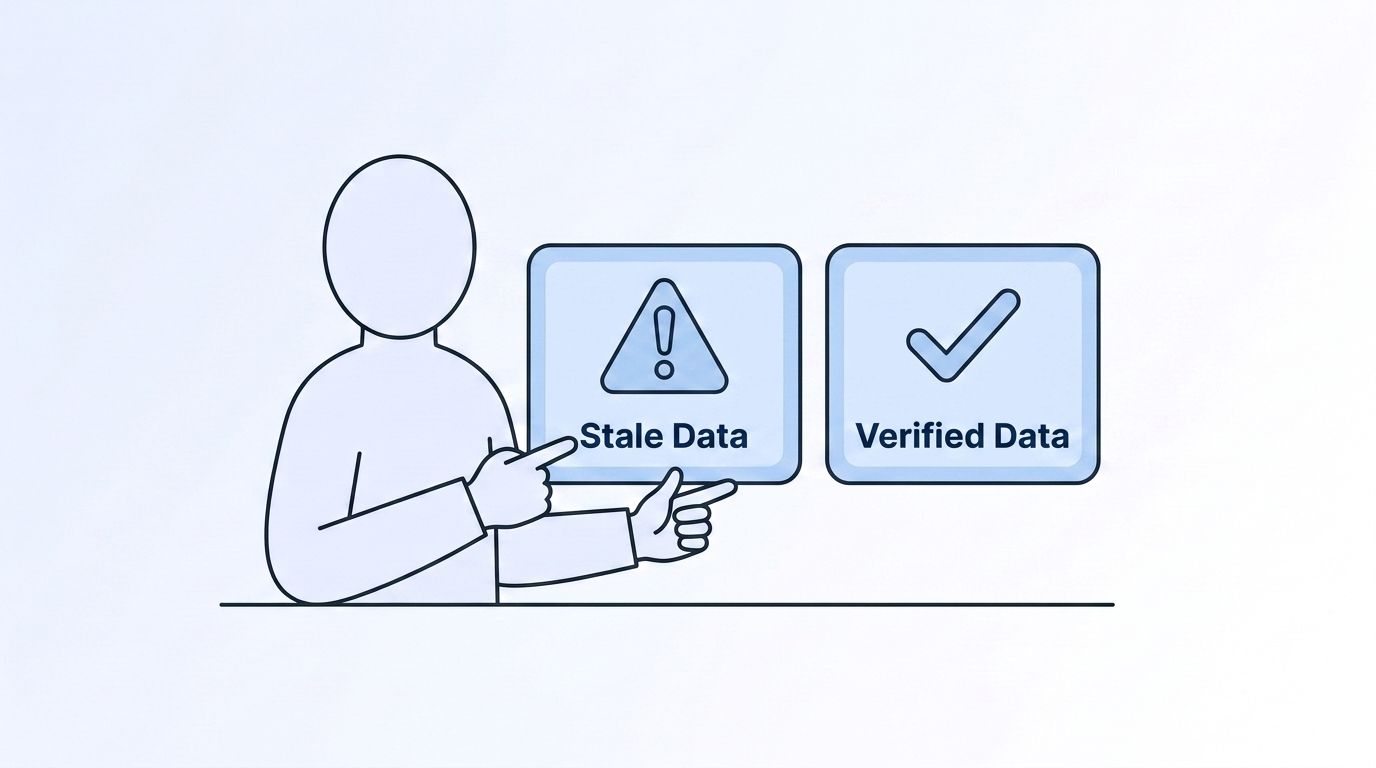
This is where the benchmarking conversation usually splits from the tool-count conversation, and it shouldn't. A CRM enrichment tool that pulls a snapshot once a quarter looks identical to a real-time one on a spend report. It looks very different in a pipeline review, when half your "current" job titles are six months stale. Benchmarking your stack means asking whether your data layer refreshes in real time or on a batch schedule — and treating that as seriously as utilization rate.
In our conversations with GTM engineering teams building enrichment pipelines, the same pattern comes up repeatedly: teams benchmark CRM cost per record, then discover the real cost was reps working stale contacts for weeks before anyone noticed the account had a new champion.
monitoring signals when a champion changes jobs
When Should You Consolidate Instead of Buying Another Tool?
Consolidate when unused or underused applications are already driving your software costs, not after you've added one more tool to "fix" the gap. 63% of organizations cite unused or underutilized applications as a primary driver of their SaaS consolidation efforts (BetterCloud, 2025 State of SaaS Report). That's a majority of companies admitting the fix came after the waste was already visible.
The practical lesson: run your utilization audit before your next renewal cycle, not during it. If you wait until a contract is up for renegotiation, you're deciding under time pressure with incomplete usage data. Quarterly utilization checks give you leverage — you walk into a renewal knowing exactly which seats to cut.
How this compares:
| Signal | Weak benchmark practice | Stronger benchmark practice |
|---|---|---|
| Timing | Audit usage at renewal | Audit usage quarterly, year-round |
| Scope | Spend per tool only | Spend + seat utilization + data freshness |
| Decision trigger | Contract deadline | Usage threshold (e.g., <50% seats active) |
| Data source | Vendor-reported usage | Independent usage export or admin console data |
comparing a static contact database against a live, pay-as-you-go data API
A Step-by-Step Framework to Benchmark Your Own Stack
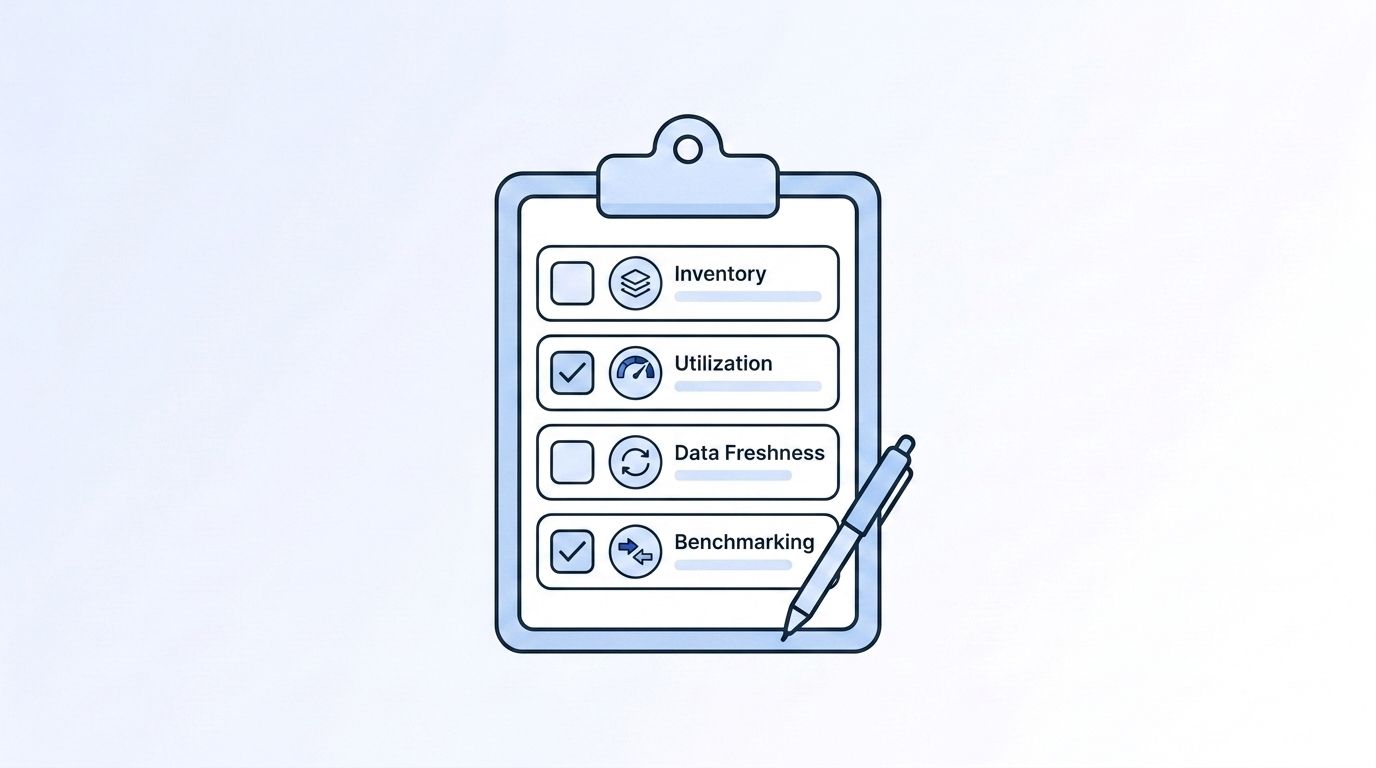
Benchmarking works best as a repeatable quarterly process, not a one-time audit you run when a CFO asks hard questions. Here's a four-step version any RevOps or GTM engineering team can run without buying new software first.
- Inventory every tool with a login, not just the ones on the invoice. Shadow-purchased tools (a rep's personal Loom account, a manager's spare Sales Nav seat) rarely show up on a vendor spend report but still count against your real tool sprawl.
- Pull 30-, 60-, and 90-day active-user counts for each tool. Most platforms expose this in an admin console. Compare active users against licensed seats — that ratio is your utilization rate, and it's the number from the section above you should be tracking internally.
- Score each tool on data freshness, not just feature set. A tool that updates company or contact data at request time behaves differently in a live pipeline than one that syncs weekly. pulling structured company and people data at request time
- Compare your utilization and consolidation readiness against the benchmarks above — 47% average seat utilization, 21% shelfware, 63% of companies citing waste as their consolidation trigger — and flag anything meaningfully below those marks for review before your next renewal.
Rerun this every quarter. A benchmark taken once tells you where you stood on one day. A benchmark tracked quarterly tells you whether your stack is trending toward the 106-app, 47%-utilization industry average, or drifting further from it.
real-time LinkedIn people data for GTM and recruiting workflows
Frequently Asked Questions
How many sales tools should a typical B2B team run in 2026?
There's no universal number, but the trend line is down: the average enterprise runs about 106 SaaS applications in 2025, versus 130 in 2022 (Zylo, 2025 SaaS Management Index). Track your own count quarterly and pair it with utilization data — count alone doesn't tell you whether tools are earning their spot.
What utilization rate signals a healthy sales tech stack?
Aim above the 47% average seat-utilization benchmark reported across enterprise software (Zylo, 2025), since sales stacks — with their many point solutions — tend to run at or below that mark. Anything near 21% shelfware, the industry average for completely unused apps (Vertice, 2025), signals a tool ready for a renewal conversation.
Should we consolidate our stack before or after benchmarking utilization?
Benchmark first. 63% of organizations only started consolidating after unused applications were already driving costs up (BetterCloud, 2025 State of SaaS Report). Running a utilization audit before your renewal cycle gives you the leverage to cut or renegotiate, instead of discovering the waste after you've already re-signed.
How do you benchmark a tool that doesn't publish usage data?
Pull active-user counts directly from the tool's own admin console rather than relying on the vendor's reported adoption numbers. Compare that count against your licensed seats over a 30-, 60-, and 90-day window. If the vendor can't produce a usage export at all, treat that as a red flag on its own.
Does CRM data freshness count as part of a tech stack benchmark?
Yes. A CRM tool can look efficient on a utilization report while still feeding reps stale contact and company data. Benchmark whether your enrichment layer updates records in real time or on a batch schedule — that distinction affects pipeline accuracy in ways a simple usage percentage won't capture.
The Bottom Line
Benchmarking your sales tech stack against peers means tracking three things together: tool count, seat utilization, and data freshness — not spend in isolation. The direction is clear across the industry. Stacks are shrinking from a 2022 peak of 130 apps toward roughly 106 today, yet over half of licensed seats still go unused, and 70% of sellers say the tech itself has become a source of overwhelm.
Run the four-step framework above once a quarter. Compare your numbers against the 47% utilization mark, the 21% shelfware rate, and the consolidation triggers other companies already hit. Then decide what to cut, what to keep, and whether your data layer is actually keeping pace with how fast your contacts change roles.
seeing which target accounts match your ICP before adding another prospecting tool
